

Not all rural communities are the same. Data from Kansas and Missouri reveal how differences across contexts can affect teacher recruitment and retention.
At a Glance
- School district hiring needs and new teacher characteristics vary across different types of communities.
- Rural districts have trouble with teacher recruitment and retention, but previous data did not adequately capture the differences between rural communities.
- The Community Assets and Relative Rurality (CARR) Index enables researchers to capture greater nuance and sort districts by rurality.
- Analysis of data from Missouri and Kansas shows how rurality, teacher diversity, teacher salaries, and teacher turnover relate to one another.
- Data about specific community types can help policy makers make better decisions about how to support and retain new teachers.
Understanding the characteristics of new teachers is essential for policy makers to design targeted support, recruitment, and training programs. One of the challenges, however, is that the teacher workforce is highly localized, with significant variation across localities and states. School district hiring needs and teacher characteristics vary considerably across geographic landscapes. Specifically, the needs of urban schools often differ substantially from those in rural locales. Moreover, the teacher workforce evolves over time. New generations of teachers entering the profession under shifting conditions may exhibit distinct patterns and require updated policies and tailored support.
Using a newly available data source describing school district rurality, we examine the demographic characteristics, qualifications, and mobility patterns of first-year teachers who have entered the teaching profession in Kansas and Missouri. We also analyze trends and changes in new teacher characteristics and mobility over time. The findings offer insights on strategies to recruit and retain diverse and high-quality teachers in rural areas.
Understanding rural contexts
Rural schools in the United States face significant challenges attracting and retaining qualified teachers (Cowen et al., 2012; Goldhaber et al., 2020). Social and professional isolation associated with rural settings often discourages new teachers from seeking or continuing employment in these areas (Rhinesmith et al., 2023). Additionally, rural schools are frequently located far from teacher education institutions, limiting access to professional development opportunities and new teacher pipelines (Goldhaber et al., 2020, 2021). The isolation from urban centers exacerbates the issue, as rural communities often lack amenities such as shopping, dining, health care services, and early childhood programs, making them less attractive to teachers, particularly those starting families (Showalter et al., 2017).
Most existing studies overlook variation among rural schools (Goldhaber et al., 2020), resulting in inconsistent findings concerning the rural teacher workforce (Nguyen, 2020a). Additionally, there has been no consistent definition of “rural” teachers. Prior work has typically relied on the National Center for Education Statistics rural school classifications, which are primarily based on population size and proximity to city centers (National Center for Education Statistics, 2022; Nguyen, 2020a). However, this approach fails to capture nuances, such as access to local services and amenities (Nelson & Nguyen, 2023), that are important to teacher retention (Goldhaber et al., 2020; Miller, 2012; Nguyen, 2020a).
The Community Assets and Relative Rurality (CARR) Index is a newly developed measure that captures various nuances of rurality (Nelson & Nguyen, 2023). Specifically, the CARR Index incorporates availability and accessibility of certain community assets — including essential services (e.g., childcare centers, banks, schools); amenities (e.g., restaurants, libraries, arts centers); and infrastructure and natural resource sites (e.g., roads, utilities, residential or commercial amenities) — as well as the community’s proximity to a metropolitan area, population density, and the share of land covered by developments such as residential homes, apartment complexes, and/or commercial facilities (Nelson & Nguyen, 2023). By fine-tuning these measures of rurality, the CARR Index enables us to examine how local area characteristics are associated with the recruitment and retention of Generation Z teachers.
The changing teacher workforce
The Pew Research Center defines Generation Z as those born between 1997 and 2012. This cohort grew up in an “always on” technological environment, which led to significant shifts in behaviors, attitudes, lifestyles, and values compared to previous generations (Dimock, 2019). While research focusing specifically on Generation Z teachers remains limited, human resource literature suggests Generation Z employees differ from the older generations in some key areas, especially career aspirations and expectations of working conditions (Barhate & Dirani, 2022).
While varying local conditions play a role in all aspects of teacher workforce development, they may be especially relevant to the recruitment of teachers new to the profession.
Notably, the first major wave of Generation Z teachers entered the workforce during the 2019-20 school year, coinciding with the onset of the COVID-19 pandemic. Emerging evidence indicates an increase in teacher turnover following the pandemic (Bacher-Hicks, Chi, & Orellana, 2023; Bastian & Fuller, 2023; Bleiberg & Kraft, 2023; Goldhaber & Theobald, 2023). Limited data suggest that this heightened turnover was higher among newly hired teachers and varied across states. For example, in Massachusetts, turnover among new teachers hired during the onset of the pandemic (2019-20) was 31.9%, comparable to pre-pandemic levels, but rose significantly to 44.8% thereafter (Bacher-Hicks, Chi, & Orellana, 2023). In contrast, turnover among first-year teachers in Utah remained stable over the pandemic; 84% to 85% of first-year hires between 2018-19 and 2022-23 returned to the classroom (Brandley, 2023).
The Kansas and Missouri contexts
Kansas and Missouri provide compelling contexts for exploring the characteristics and mobility of new teachers across diverse geographical settings. These states contain some of the most geographically isolated regions in the U.S. (Nguyen, 2020b) and some of the nation’s historically industrialized metro areas (e.g., St. Louis, Kansas City, Wichita). Moreover, the demographic disparity between students and teachers of color is pronounced: The two states have approximately four times as many students of color as teachers of color (Swisher, 2023). Their teacher diversity has remained stagnant over the past decade, even as student diversity continues to grow (Lam et al., 2025). Additionally, Kansas and Missouri rank among the lowest in average educator salaries (National Education Association, 2025), particularly for rural teachers (Showalter et al., 2023), highlighting additional challenges educators face in these states.
This study uses data from the 2010-11 to 2022-23 school years, covering all newly entered teachers with no prior teaching experience in Kansas and Missouri public schools. The sample includes more than 20,000 new teachers in Kansas and more than 37,000 in Missouri. Generation Z teachers first appeared in the sample in the 2019-20 cohort, when they made up 12% of newly entered teachers in the two states. By 2022-23, their share of the workforce had reached approximately 54%.
New teacher characteristics and mobility patterns
We begin by examining how teacher characteristics and mobility patterns vary across levels of rurality. Using the CARR Index, we sorted the Kansas and Missouri school districts into five quintiles according to their levels of rurality. The first quintile (Q1) represents the most urban districts with the greatest access to services and amenities, while the fifth quintile (Q5) represents the most rural districts with the least access. Table 1 summarizes the characteristics of brand-new teachers in Kansas and Missouri across the CARR Index quintiles.
Table 1. New teacher characteristics and mobility patterns by rurality level
|
Panel A: Kansas new teachers |
|||||
|
Q1-most urban |
Q2 |
Q3 |
Q4 |
Q5-most rural |
|
|
Characteristics |
|||||
|
% Female |
79.75 |
75.37 |
71.01 |
74.35 |
71.53 |
|
% Teachers of color |
11.58 |
6.59 |
6.23 |
5.12 |
11.52 |
|
% White |
88.42 |
93.41 |
93.77 |
94.88 |
88.48 |
|
% Graduate degree |
19.2 |
12.43 |
12.31 |
12.9 |
12.87 |
|
% Part-time |
9.86 |
13.61 |
23.62 |
18.88 |
14.17 |
|
Inflation adjusted base salary ($K) |
46.83 |
42.70 |
41.89 |
40.32 |
43.57 |
|
Mobility |
|||||
|
% School switchers |
4.61 |
3.04 |
1.98 |
1.89 |
4.22 |
|
% District switchers |
5.31 |
9.92 |
11.98 |
11.95 |
7.32 |
|
% Leavers |
11.35 |
10.18 |
11.67 |
10.83 |
13.37 |
|
% Total turnover |
21.27 |
23.14 |
25.63 |
24.68 |
24.90 |
|
Observations |
12,748 |
2,477 |
1,397 |
1,271 |
2,160 |
|
Panel B: Missouri New Teachers |
|||||
|
Q1-most urban |
Q2 |
Q3 |
Q4 |
Q5-most rural |
|
|
Characteristics |
|||||
|
% Female |
77.34 |
75.25 |
73.36 |
73.6 |
72.11 |
|
% Teachers of color |
12.19 |
3.01 |
2.15 |
2.75 |
1.78 |
|
% White |
87.81 |
96.99 |
97.85 |
97.25 |
98.22 |
|
% Graduate degree |
18.59 |
10.1 |
9.83 |
8.86 |
11.03 |
|
% Part-time |
9.18 |
12.24 |
16.31 |
18.08 |
19.46 |
|
Inflation adjusted base salary ($K) |
43.80 |
38.62 |
37.42 |
36.21 |
34.04 |
|
Mobility |
|||||
|
% School switchers |
5.92 |
3.38 |
3.05 |
2.38 |
2.39 |
|
% District switchers |
7.32 |
10.53 |
11.63 |
11.69 |
11.18 |
|
% Leavers |
12.2 |
8.96 |
9.09 |
10.22 |
11.14 |
|
% Total turnover |
25.44 |
22.88 |
23.77 |
24.3 |
24.72 |
|
Observations |
21,476 |
6,077 |
4,009 |
3,341 |
2,919 |
Note: Teacher characteristic variables are generated by the average across the 2010-11 to 2022-23 school years. Teacher turnover pattern variables are calculated for the 2010-11 through 2021-22 period. To distinguish the rurality of districts in Kansas and Missouri, we use quintiles of the Community Assets and Relative Rurality (CARR) Index, with the first quintile (Q1) representing the most urban areas and the fifth quintile (Q5) representing the most rural areas. The base salary figures are adjusted to 2022-23 dollars.
First, we note that the majority of new teachers in Kansas and Missouri begin their career in the most urban districts (Q1). The majority are women, though the proportion of male teachers is higher in the most rural districts (80% and 77% women in the most urban Kansas and Missouri districts, respectively, compared to 72% women in the most rural districts in both states). While most new teachers are white, racial composition varies substantially. In Kansas, the percentage of white teachers goes up as districts are more rural, except in the most rural quintile (Q5), where nearly 12% of new teachers are teachers of color — a percentage almost as high as the most urban districts (Q1).
In other words, new teachers of color in Kansas are not only concentrated in the most urban districts, but also in the most rural districts. This notable trend likely reflects the growing Hispanic population across Kansas, including both urban centers and several Census-designated rural areas in the Southwest region (Center for Economic Development and Business Research, 2024). In contrast, in Missouri, 88% of new teachers in Q1 are white, while at least 97% of new teachers in all more rural districts are white.
Next, we observe that one in five new teachers in both states has a graduate degree in the most urban districts (Q1), while teachers in more rural districts are less likely to have graduate degrees. In Kansas, a small portion, 10%, of new teachers in Q1 are employed part-time, but a much larger portion of new teachers in Q3 and Q4 are part-time teachers (24% and 19% respectively). In Missouri, part-time status grows as districts become more rural with fewer services and amenities.
We then analyze the base salary for new teachers, defined as the regular-term contract salary, excluding supplemental contracts and fringe benefits. To ensure comparability across years, salaries are inflation-adjusted to the 2022-23 academic year (Shores & Candelaria, 2020). While new teachers in Kansas earn almost $47,000 on average in urban districts (Q1), they earn less in more rural districts, with a low of $40,000 in Q4. In Missouri, new teachers in Q1 earn $44,000 on average, while new teachers in Q5 earn only $34,000. While new teachers in more rural districts tend to earn less than their counterparts in more urban districts, this does not hold true for the most rural districts in Kansas where they earn $44,000 a year on average.
Our findings indicate that even in rural states with many outward similarities, trends in the demographic characteristics, turnover patterns, and compensation of the new generation of teachers can vary widely.
Lastly, we examine teacher turnover by tracking whether newly entered teachers switch schools within their districts (“school switchers”); move to a different district (“district switchers”); or leave the state’s public schools entirely (“leavers”) the following year. About a quarter of new teachers in Kansas and Missouri depart after their first year, with some variation by state and rurality. In Kansas, 21% of new teachers in the most urban districts (Q1) switch or leave at the end of their first year. Turnover increases to 23% in Q2 and remains around 25% in Q3, Q4, and Q5. Most first-year turnover in Kansas is made up of leavers, with about 11% of new teachers exiting the state’s public schools entirely. New Kansas teachers also are more likely to switch districts than switch schools within the same district, particularly in more rural districts. The mobility pattern is similar for Missouri. However, turnover rates do not vary significantly across levels of rurality, consistently ranging from 23% to 25%.
Trends over time
Next, we examine how these patterns have evolved over time, particularly during the COVID-19 pandemic. Figures 1 to 3 illustrate changes in the percentage of teachers of color, teacher base salaries, and mobility patterns for each state from the 2010-11 to 2022-23 academic years.
Teachers of color
In general, while annual fluctuations exist, Figure 1 shows an increasing share of teachers of color joining the teaching workforce in both Kansas and Missouri over the years. The average percentage of new teachers in Kansas who identified as teachers of color rose from 7% in 2010-11 to 13% in 2022-23, while in Missouri, it increased from 6% to 12%.
However, these trends vary significantly by rurality and state. In Kansas, the percentage of new teachers of color is highest in the most urban (Q1) and most rural (Q5) districts. Since the pandemic, around 15% of new teachers in Q1 and Q5 in Kansas are teachers of color. In contrast, in Missouri, over 10% of new teachers in the most urban districts (Q1) are teachers of color. By 2022-23, that percentage rose to 18%. The growth of new teachers of color in Missouri has occurred almost entirely in the most urban districts, with little change in more rural areas, where the percentage generally stayed under 5%.
Figure 1. Yearly changes in percentage of new teachers of color by rurality level
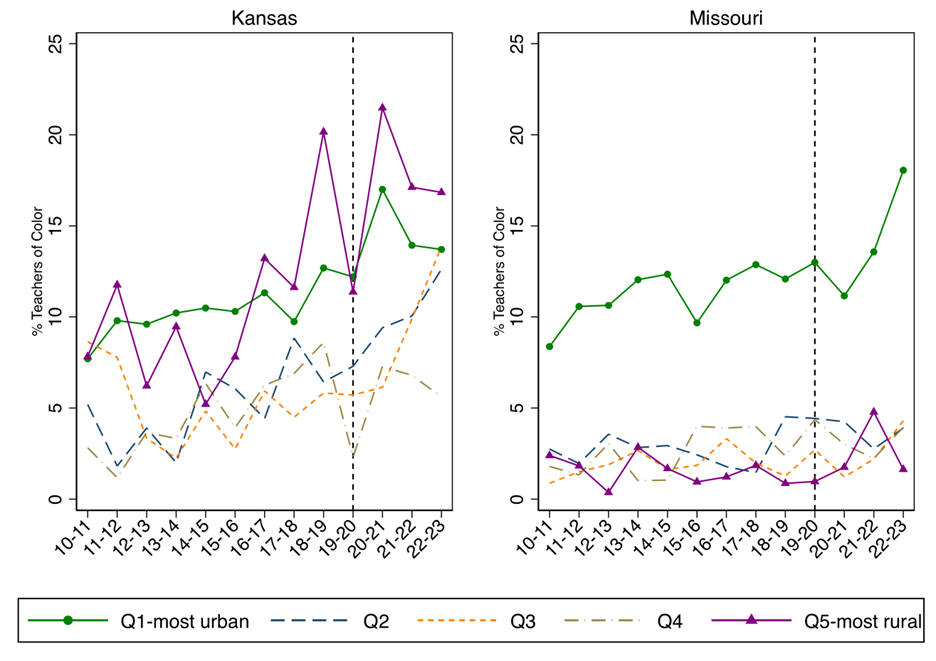
Note: The x-axes represent academic years, with labels such as “10-11” indicating the 2010-11 school year. The dashed black vertical line marks the 2019-20 school year, which signifies the onset of the COVID-19 pandemic and the entry of Generation Z teachers into the teaching workforce. The first quintile (Q1) of the Community Assets and Relative Rurality (CARR) Index corresponds to the most urban areas, while the fifth quintile (Q5) represents the most rural areas.
Base salaries
The inflation-adjusted base salary for new teachers has declined over time in both Kansas and Missouri. While the downward trend was relatively mild before the COVID-19 pandemic, a sharp salary drop occurred across all groups in both states post-pandemic. By the 2022-23 school year, a slight increase was observed for some new teachers in Missouri, but not in Kansas.
Furthermore, disparities in new teacher base salaries across levels of rurality differ between the two states. As shown in Figure 2, in 2010-11, there was at least a $3,000 disparity in base salaries for new teachers in the most urban districts (Q1) compared to more rural districts (Q2-Q5) in Kansas. This disparity has closed over time, but that’s mainly due to a base salary decrease in Q1. In contrast, Missouri’s salary gaps between urban and rural districts have been both wider and more persistent. By 2022-23, the base salary gap between Q1 and Q5 in Missouri was about $9,000.
Figure 2. Yearly changes in new teacher inflation-adjusted base salary by rurality level
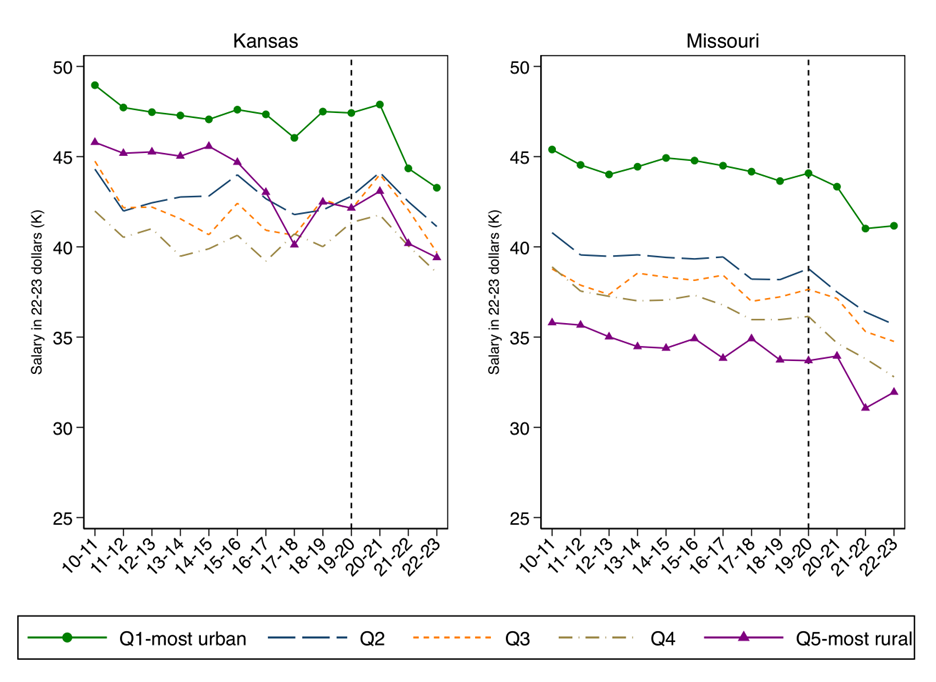
Note: The x-axes represent academic years, with labels such as “10-11” indicating the 2010-11 school year. The dashed black vertical line marks the 2019-20 school year, which signifies the onset of the COVID-19 pandemic and the entry of Generation Z teachers into the teaching workforce. The first quintile (Q1) of the Community Assets and Relative Rurality (CARR) Index corresponds to the most urban areas, while the fifth quintile (Q5) represents the most rural areas. The base salary figures are adjusted to 2022-23 dollars.
Teacher mobility
Figure 3 shows that new teachers who exit public schools altogether constitute the largest portions of teacher turnover in both states, a pattern that has persisted over time. After the onset of the COVID-19 pandemic, new teacher turnover increased in both states. However, in Kansas, there were years with even higher overall turnover rates than their post-pandemic peak in 2021-22 (i.e., 2012-13, 2016-17). In contrast, Missouri’s new teacher overall turnover rate reached an all-time high of nearly 30% in 2021-22, up from 23.2% in 2019-20, the year the pandemic began. This marks a 28% increase in the turnover rate for new teachers in Missouri, with most of the increase driven by teachers leaving for a different district than the one where they began their careers.
Figure 3. Turnover among new teachers from 2010-11 through 2021-22
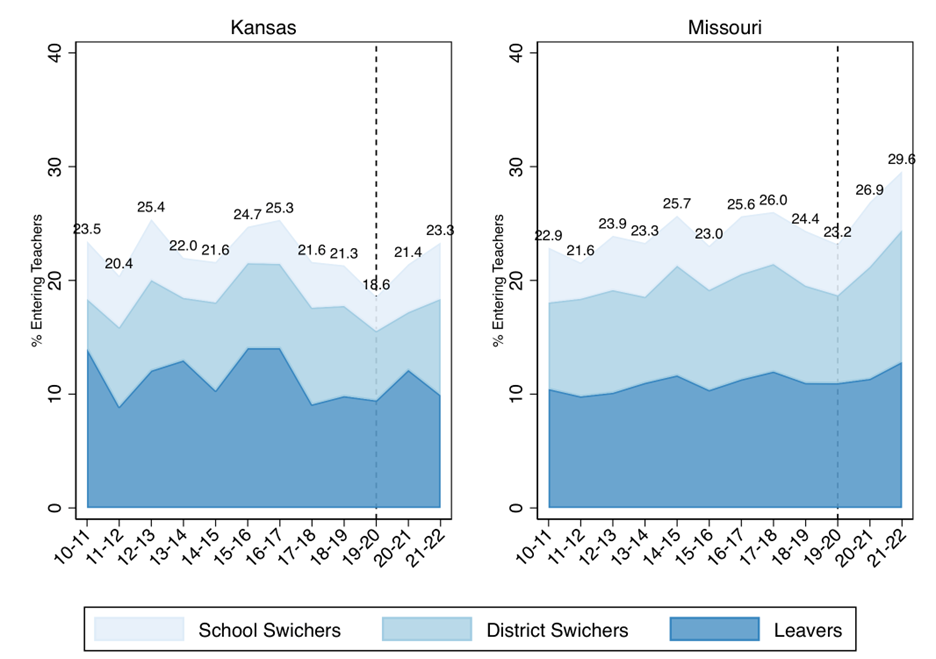
Note: The x-axes represent academic years, with labels such as “10-11” indicating the 2010-2011 school year. The y-axes show the percentage of new teachers in each school year who turned over before the following school year. The numbers above the shaded areas indicate the total turnover rate for each year, combining the percentages of school switchers, district switchers, and leavers. The dashed black vertical line marks the 2019-2020 school year, which signifies the onset of the COVID-19 pandemic and the entry of Generation Z teachers into the teaching workforce.
Implications for educational practice and policy
Amid persistent reports of teacher shortages, increased teacher turnover, and deteriorating teacher working conditions, school districts and states have strategized new policies and practices to strengthen their respective teacher workforces. One key priority among many districts is to diversify their newest cohorts of teachers, enacting practices that help them persist in the profession. High turnover and shortages, however, vary extensively by state and local context (e.g., Nguyen, Lam, & Bruno, 2024), suggesting successful interventions should consider and tailor their approaches to the evolving nuances of local conditions rather than pursuing one-size-fits-all remedies. While varying local conditions play a role in all aspects of teacher workforce development, they may be especially relevant to the recruitment of teachers new to the profession, many of whom have begun their careers or been educated during the unique circumstances of the pandemic.
Even in two contiguous Midwest states, we find teacher workforce attributes in rural schools vary substantially, including among the new generation of teachers. For example, while both states have asserted their goals to diversify their teacher workforces, rural districts in Kansas have enjoyed much more success in this than their Missouri counterparts, where only the most urban districts have improved over the past decade. Though both states have witnessed sharp declines in inflation-adjusted starting teacher salaries, salary gaps across rurality have shrunk in Kansas but not in Missouri.
Researchers and policy makers have expressed growing concern about the declining attractiveness and prestige of the teaching profession (Kraft & Lyon, 2024). One contributing factor is stagnant teacher pay (Kraft & Lyon, 2024), exacerbated by the widening pay gap between public school teachers and college graduates in other professions (Allegretto, 2024). Our analysis shows that inflation-adjusted base salaries for teachers in Kansas and Missouri have declined, especially post-pandemic, mirroring national trends (Kraft & Lyon, 2024). While average new teacher salaries appear to have increased, post-pandemic inflation has eroded their real value, leaving them at their lowest level since 2010. With inflation outpacing salary adjustments, teacher wages will continue to lag without significant policy intervention.
New policies and initiatives may address some — but likely not all — concerns about salaries. In recent years, Missouri has increased its minimum starting teacher salary to $40,000, which will likely dramatically increase rural teacher salaries across the state (Anglum, Manion, & Varkey, 2024). The districts that stand to benefit the most from increased salaries have not improved their recruitment of teachers of color. In the years to come, we will see if improved salaries attract a more diverse cohort of new rural teachers and improve the state’s near 30% turnover rate.
New teachers in Kansas’ rural schools are the most likely to leave the state’s public schools altogether, whereas attrition in Missouri is highest among urban teachers. To combat teacher turnover, nearly half of Missouri’s rural schools have pursued new four-day school week policies (e.g., Camp et al., 2024), nearly sixfold the amount in Kansas. However, four-day policies have not proven effective in improving teacher turnover in Missouri’s rural districts (Camp et al., 2024) or in rural areas in other states (e.g., Ainsworth, Penner, & Liu., 2024).
Perhaps most of all, our findings indicate that even in rural states with many outward similarities, trends in the demographic characteristics, turnover patterns, and compensation of the new generation of teachers can vary widely. New analytic tools such as the CARR Index can help the research community inform state and local district leaders of trends specific to their local circumstances.
Many prospective teachers may favor the characteristics of particular school settings, be they the tight-knit community orientation of many rural areas (Rhinesmith et al., 2023) or the robust access to cultural amenities of many urban centers. Accurately describing such settings, and the teacher workforce characteristics that often accompany them, therefore, may help target new policies to address a distinctly different post-pandemic teaching landscape.
Note: Thanks to J.R. Funk for providing research assistance on this project.
References
Ainsworth, A.J., Penner, E.K., & Liu, Y. (2024). Less is more: The causal effect of four-day school weeks on employee turnover [EdWorkingPaper 24-1035]. Annenberg Institute at Brown University.
Allegretto, S. (2024). Teacher pay rises in 2023 — but not enough to shrink pay gap with other college graduates. Economic Policy Institute.
Anglum, J.C., Manion, A., & Varkey, S. (2024). Increasing minimum teacher salaries: Opportunities and drawbacks across geography and race. Urban Affairs Review, 60 (6), 1-25.
Bacher-Hicks, A., Chi, O.L., & Orellana, A. (2023). Two years later: How COVID-19 has shaped the teacher workforce. Educational Researcher, 52 (4), 219-229.
Barhate, B. & Dirani, K.M. (2022). Career aspirations of generation Z: A systematic literature review. European Journal of Training and Development, 46 (1/2), 139-157.
Bastian, K.C. & Fuller, S.C. (2023). Educator attrition and mobility during the COVID-19 pandemic. Educational Researcher, 52 (8), 516-520.
Bleiberg, J.F. & Kraft, M.A. (2023). What happened to the K-12 education labor market during COVID? The acute need for better data systems. Education Finance and Policy, 18 (1), 156-172.
Brandley, A.T. (2023). K-12 teacher shortages, retention, and salaries in Utah. Kem C. Gardner Policy Institute at the University of Utah.
Camp, A M., Wilson, T., Liu, Y., Anglum, J.C., Manion, A., & Nguyen, T.D. (2024). Teacher retention and the four-day school week in Missouri (Research Brief). Policy Research in Missouri Education Center at Saint Louis University.
Center for Economic Development and Business Research. (2024). 2024 Kansas population forecast regional report. Wichita State University.
Cowen, J.M., Butler, J.S., Fowles, J., Streams, M.E., & Toma, E.F. (2012). Teacher retention in Appalachian schools: Evidence from Kentucky. Economics of Education Review, 31 (4), 431-441.
Dimock, M. (2019). Defining generations: Where Millennials end and Generation Z begins. Pew Research Center.
Goldhaber, D., Krieg, J., Naito, N., & Theobald, R. (2021). Student teaching and the geography of teacher shortages. Educational Researcher, 50 (3), 165-175.
Goldhaber, D., Strunk, K.O., Brown, N., Naito, N., & Wolff, M. (2020). Teacher staffing challenges in California: Examining the uniqueness of rural school districts. AERA Open, 6 (3).
Goldhaber, D. & Theobald, R. (2021). Teacher attrition and mobility over time. Educational Researcher, 51 (3), 235-237.
Goldhaber, D. & Theobald, R. (2023). Teacher turnover three years into the pandemic era: Evidence from Washington state (CALDER Policy Brief No.32-0223). Center for Analysis of Longitudinal Data in Education Research.
Kraft, M.A. & Lyon, M.A. (2024). The rise and fall of the teaching profession: Prestige, interest, preparation, and satisfaction over the last half century. American Educational Research Journal, 61 (6), 1192-1236.
Lam, C.B., Liu, Y., Anglum, J.C., & Nguyen, T.D. (2025). STEM teacher characteristics and mobility: Longitudinal evidence from the American Midwest, 2010 through 2023. Journal of Research in Science Teaching.
Miller, L.C. (2012). Situating the rural teacher labor market in the broader context: A descriptive analysis of the market dynamics in New York state. Journal of Research in Rural Education, 27 (13), 1-31.
National Center for Education Statistics. (2022, February 25). National Center for Education Statistics (NCES) locale classifications and criteria. U.S. Department of Education.
National Education Association. (2025, April 29). Starting teacher salaries. National Education Association.
Nelson, K.S. & Nguyen, T.D. (2023). Community assets and relative rurality index: A multi-dimensional measure of rurality. Journal of Rural Studies, 97, 322-333.
Nguyen, T.D. (2020a). Examining the teacher labor market in different rural contexts: Variations by urbanicity and rural states. AERA Open, 6 (4).
Nguyen, T.D. (2020b). Teacher attrition and retention in Kansas: A case study of geographically rural states with persistent teacher shortages. Online Journal of Rural Research & Policy, 15 (1).
Nguyen, T.D., Lam, C.B., & Bruno, P. (2024). What do we know about the extent of teacher shortages nationwide? A systematic examination of reports of U.S. teacher shortages. AERA Open, 10.
Rhinesmith, E., Anglum, J.C., Park, A., & Burrola, A. (2023). Recruiting and retaining teachers in rural Schools: A systematic review of the literature. Peabody Journal of Education, 98 (4), 347-363.
Shores, K. & Candelaria, C. (2020). Get real! Inflation adjustments of educational finance data. Educational Researcher, 49 (1), 71-74.
Showalter, D., Hartman, S.L., Eppley, K., Johnson, J., & Klein, B. (2023). Why rural matters 2023: Centering equity and opportunity. National Rural Education Association.
Showalter, D., Klein, R., Johnson, J., & Hartman, S. L. (2017). Why rural matters 2015-2016: Understanding the changing landscape. The Rural School and Community Trust.
Swisher, A. (2023). State of the states 2023: Policies to increase teacher diversity. National Council on Teacher Quality.
This article appears in the Fall 2025 issue of Kappan, Vol. 107, No. 1-2, pp. 28–35.

ABOUT THE AUTHORS

Yujia Liu
Yujia Liu is a post-doctoral fellow at the College of Education and Human Development, University of Missouri, Columbia.
Chanh B. Lam
Chanh B. Lam is a data analyst at the College of Education, Kansas State University, Manhattan.

J. Cameron Anglum
J. Cameron Anglum is an assistant professor in the educational leadership program at the College of Education, Lehigh University, Bethlehem, Pennsylvania.
Tuan D. Nguyen
Tuan D. Nguyen is an associate professor at the College of Education and Human Development, University of Missouri, Columbia.


