

An analysis of spending in U.S. public schools reveals dozens of districts — many with large Latinx enrollments — that are underfunded compared to other districts in their region, even though they serve children with much greater needs.
When analyzing questions of fairness in local education spending, it’s important to understand that the value of the education dollar is relative. It doesn’t just matter how much money, in total, a school district spends but also how that figure compares to spending in nearby districts. After all, schools in the same area must compete with each other for employees. The district that spends $15,000 per pupil will have a harder time hiring and retaining the area’s highest-quality teachers and staff than will the neighboring district that spends $20,000. Moreover, each dollar will go further in districts that serve relatively affluent students than in those that serve large numbers of students from low-income backgrounds, who tend to need more (and more expensive) services.
Several years ago, one of us (Bruce Baker) set out to identify public school districts that face this kind of competitive disadvantage — more specifically, districts where the students face greater needs than in surrounding districts (i.e., child poverty is more than 20% higher) but where per-pupil spending is less than 90% of the region’s average.
At the time, a number of national reports had just been published comparing the overall fairness of states’ school finance systems (Baker & Corcoran, 2012; Baker, Sciarra, & Farrie, 2014). But studies were also beginning to show a lot of variation within states. Even in those states that appeared to have relatively well-funded and equitable school finance systems, some districts were being left out. And that raised the question: Did those districts have something in common?
The answer turned out to be yes. Those districts where students’ needs were greater but the schools were relatively under-resourced were disproportionately located in smaller cities that served high proportions of Latinx students (Baker, 2014; Schoolfinance101, 2012). Many were what we might call “second cities” (cities with smaller populations than the largest cities in the state); these include such places as Utica, New York; Reading and Allentown, Pennsylvania, and Waukegan, Illinois. And some — such as Union City, West New York, Passaic, and New Brunswick, New Jersey, and Everett, Lowell, and Revere, Massachusetts — were located in states that had, in an overall sense, relatively progressive funding systems.
In general, those of us who conduct large-scale studies of school finance tend to focus on education spending in very large urban centers. However, over the past several decades, many smaller cities have seen substantial demographic changes, and they have important stories to tell. Often, they lack the robust commercial and industrial tax bases of larger cities, which limits their capacity to fund their local schools. Compared to major urban centers, they tend to carry less weight in state legislatures. And while the populations of larger cities tend to be more racially and economically diverse, smaller cities are more likely to be predominantly Latinx (and/or to have fast-growing Latinx populations).
No improvement over time
Below, we describe the results of new and ongoing research into school districts that have greater needs but less funding than others in their region. In an analysis of national data available on the School Finance Indicators Data System (SFID) — an online tool created by the Albert Shanker Institute and Rutgers University, available at schoolfinancedata.org— we found that, as of the most recent (2017) available data, there are 66 non-rural school districts across the country where child poverty is more than 20% higher than in surrounding districts and per-pupil spending is less than 90% of the area’s average.
Among those 66 districts, most (53) have majority Black and/or Latinx enrollments, and in more than half (36), enrollments are predominantly Latinx. (Enrollments are predominantly Black in seven districts.)
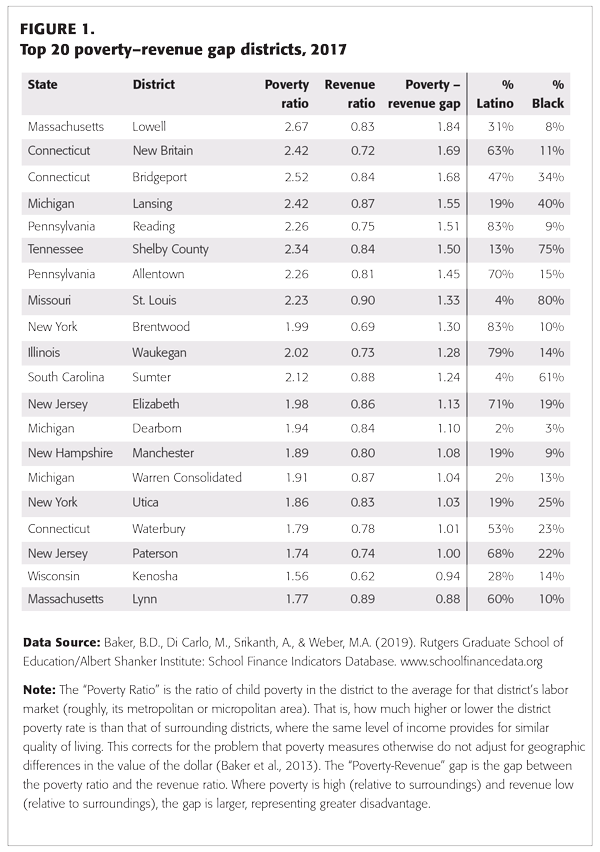
As found in the earlier research, many of these disadvantaged districts are located in second cities in states like Connecticut, Illinois, Pennsylvania, New York, and Massachusetts. Some of them (including the cities of Chicago, St. Louis, and Philadelphia) are predominantly Black school districts in major urban areas. But the ones that top the list year after year are predominantly Latinx second-city districts like Allentown, Reading, Waukegan, and New Britain, Connecticut. Over time, some districts have jumped onto and off of this list, but these second cities have been constants over the past decade, and in some cases, their spending disadvantages have only worsened. (Figure 1 shows the 20 districts, out of the 66 we’ve identified, that are most disadvantaged.)
Three cities: A deeper dive
To get a better sense of the contexts in which predominantly Latinx school districts have become so disadvantaged (in terms of per-pupil spending), we took a closer look at three of the most disadvantaged districts on this list — New Britain, Reading, and Waukegan — analyzing long-term population changes and economic conditions in each city and the state to which it belongs.
Figure 2 shows the growth of the Latinx population in these cities over nearly two decades, compared to that of their states. In the late 1980s, all three districts already had relatively high shares of Latinx enrollments, around 30%. By 2017, Waukegan and Reading had reached approximately 80% Latinx enrollment, and New Britain more than 60%. During that period, the overall Latinx enrollment in Pennsylvania rose from 2.2% to 10.2%, while it climbed from roughly 8.5% to more than 20% in both Illinois and Connecticut.
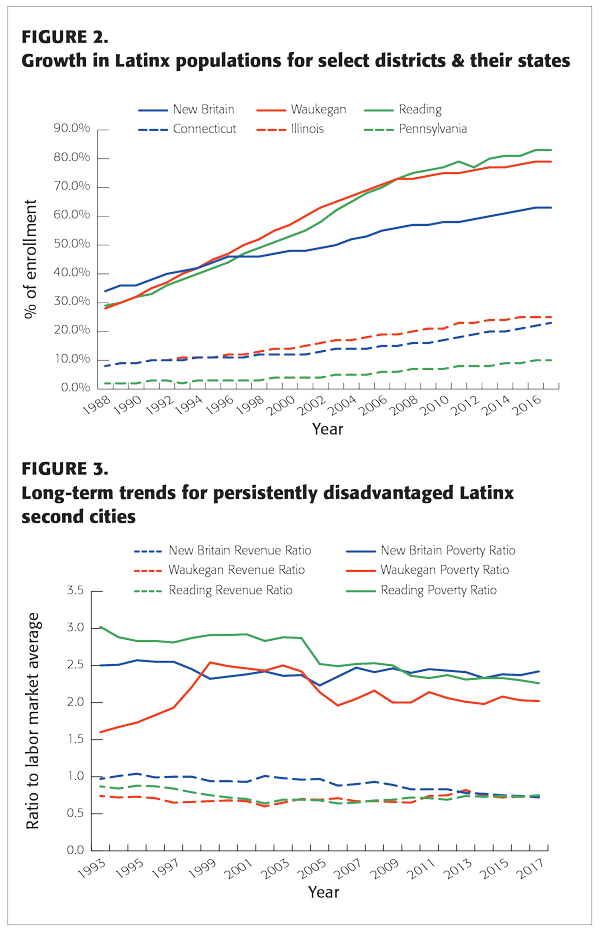
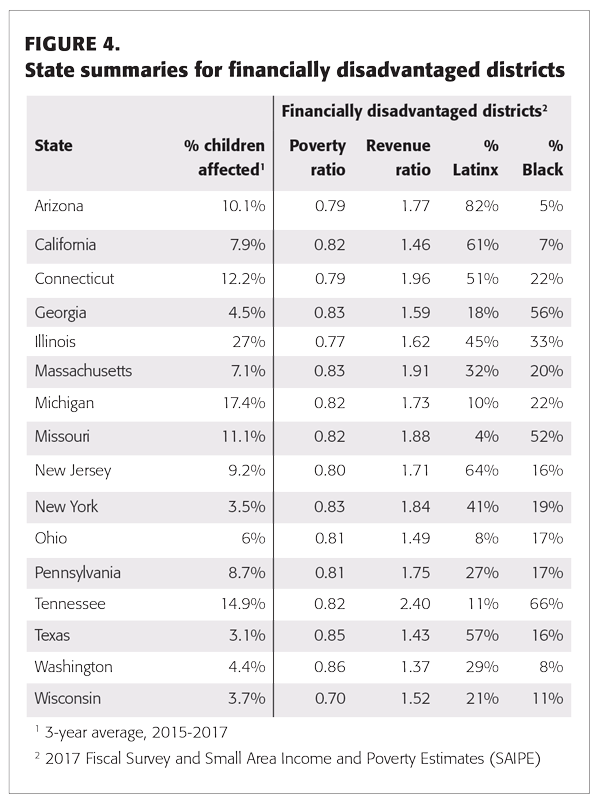
Figure 3 shows how these districts’ funding has compared, from 1993 to 2017, to that of surrounding districts, and it also shows changes in their poverty rates relative to those nearby districts. For example, in 1993, Reading’s relative child poverty rate was at its highest point of 3.0, meaning three times the average for districts in its area of Pennsylvania. That year, Reading’s revenue per pupil stood at .84, or just 84% of the average revenue of its surrounding districts.
In 1995, New Britain reached a high mark for its relative state and local revenue of 1.04 — or 4% above labor market average, meaning its per-pupil spending was slightly higher than that of other districts in the area. This was when the city’s Latinx population was still in the minority. By 2017, though, New Britain’s revenue had dropped to 72% of the region’s average, while its relative poverty rate had held constant at nearly 2.5 times the average. In other words, New Britain’s poverty rate remained steady over those years, but once its population became predominantly Latinx, the city became dramatically less able than the surrounding districts to fund its public schools.
The year 1995 was also the high point of school district spending for Reading, at 88% of the average for districts in the area. Over these 14 years, the city’s rate of relative poverty declined somewhat (not because the city became wealthier, but because the surrounding areas became less wealthy). Even so, by 2017 the poverty rate in Reading was more than 2.25 times the region’s average, while its school district revenue had dropped to only 75% of surrounding districts. Meanwhile, Waukegan’s school spending hovered at around 75% of the area’s average (reaching 82% briefly in 2013), while its child poverty rate — after climbing in the late 1990s — has hovered at about double the average.
These districts, and more important, the children they serve, simply have never been given a fair shot at obtaining the resources needed to achieve the same outcome goals as their peers in surrounding districts. As these districts have become increasingly Latinx, they have seen their relative funding levels decline, making it harder for them to meet their students’ needs and compete with neighboring districts for high quality teachers and staff.
State-level context
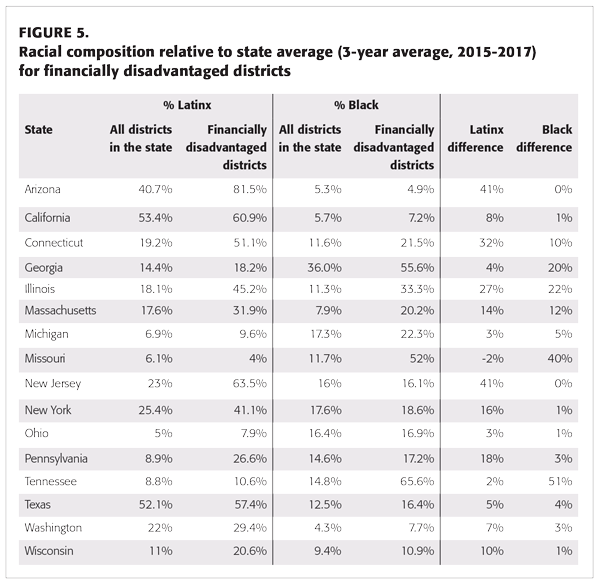
In Figure 4, we provide summary data for states with multiple districts — and significant numbers (>50,000) of students — that are severely disadvantaged relative to their neighbors. Note that in Arizona, Connecticut, Illinois, Michigan, Missouri, and Tennessee, more than 10% of all students in the state live in financially disadvantaged districts. In Illinois, Missouri, and Tennessee, this is accounted for largely by those states’ predominantly Black major urban centers (Chicago, St. Louis, and Memphis/Shelby County). However, in Arizona and Connecticut — as in California, New Jersey, and Texas — financially disadvantaged school districts tend to be majority Latinx. (This may not be surprising in Arizona, California, and Texas, where Latinx student enrollments are large across the board, but that is not the case in New Jersey and Connecticut.)
Note also that for a school district to be relatively disadvantaged in a state like Arizona or California (or even Texas) — which have some of the lowest average district revenues in the country — it must be severely under-resourced. In other words, these are districts that have even higher poverty and less revenue than nearby districts that have scarce resources themselves!
Figure 5 shows the overall percentages of Latinx and Black students enrolled in each of these states, compared to the Latinx and Black enrollments in financially disadvantaged districts. For instance, Arizona schools are about 40.7% Latinx overall, but enrollment in the state’s most disadvantaged districts are 81.5% Latinx. In California, school enrollments are majority Latinx overall, but Latinx enrollments are even higher in that state’s most disadvantaged districts.
In Connecticut, Georgia, Illinois, Massachusetts, Missouri, and Tennessee, disadvantaged districts have a Black population share that is at least 10% higher than in non-disadvantaged districts. And in Arizona, Connecticut, Illinois, Massachusetts, New Jersey, New York, Pennsylvania, and Wisconsin, disadvantaged districts have at least a 10% higher Latinx population share than non-disadvantaged districts. Where those lists overlap — i.e., Connecticut, Illinois, and Massachusetts — both Black and Latinx students are especially likely to live in disadvantaged districts.
Shifting the political terrain
Researchers have previously analyzed national data on school spending and student outcomes within individual states (Baker, 2016), but new data from the Stanford Education Data Archive, combined with our School Funding Indicators Data, provide a unique opportunity that our team at Rutgers University is taking advantage of to develop what we’ve called our National Education Cost Model (Baker et al., 2018). This model attempts to draw on the available data to determine what it would cost to bring all students up to a similarly ambitious level of educational attainment, regardless of their varying backgrounds and geographic contexts.
Our early work with this model has sought to understand areas of need, and as reported here, we have found that these predominantly Latinx, high-poverty second cities tend to have far fewer resources than needed to achieve even current national levels of attainment (Baker et al., 2018).
Yet, even as data show that some districts lack sufficient resources to achieve state-mandated outcome targets, state accountability systems continue to rate, rank, and sanction local public school districts, schools, and, in some cases, individual teachers for failing to meet these goals. This is simply unfair. And to the extent these sanctions fall disproportionately on schools and teachers serving predominantly Latinx populations (in large part, because of states’ failure to fund these districts adequately), these policies strike us as discriminatory. New Britain, for example, cannot reasonably be held to the same standards as Connecticut’s more affluent suburbs unless and until the state does its part to adequately fund that district’s schools (along with those in Waterbury, Bridgeport, and elsewhere).
Equitable state school finance systems require that state legislators have the political will to aggressively redistribute available revenues to districts and children with the greatest needs. Not only does there have to be enough money in the pot, it also has to be distributed well, by way of a necessarily political deliberative process. As such, balanced representation and political power are absolutely necessary to achieve equitable school funding. But such balance rarely exists.
In some states, judicial oversight has mitigated some of these disparities and, to an extent, leveled up overall funding. New Jersey, given the strength of its court-ordered funding plans and legislative responses, has been perhaps the most aggressive in this regard. But even in New Jersey, some financially disadvantaged districts were “left out” of those remedies, and these districts tend to be predominantly Latinx.
In the three states highlighted above, attempts to remedy school funding disparities through litigation have failed, most recently in Connecticut. Further, even where litigation does lead to favorable judicial rulings and state oversight, the effectiveness of the remedies depends on legislative action and political will. The road to systematic and sustained school finance reform requires simultaneous and sustained effort on multiple fronts.
In some states, Latinx students now represent a majority — or, in states like Connecticut and Illinois, the second largest share—of public school enrollments. The dire plight of their schools has much to do with their lack of political representation, relative to the size of the Latinx population, which reinforces persistent and, in some cases, intergenerational disadvantage.
When state and local voters and elected officials differ racially from local constituents who most need services, public expenditures tend to fall short of demand. Put more bluntly, an aging White electorate is unlikely to increase spending on an increasingly Black and Latinx student population. As our data analyses have shown, these political patterns have led over time to stark and persistent educational disadvantages for certain communities. Until state legislative leadership is more representative of the student populations in public schools, significant and sustained school finance remedies seem unlikely.
Historically, the diversity within the Latinx population has made it challenging to organize politically to find solutions to these problems. Indeed, to some extent, the notion of a single Latinx, or Hispanic, community is a U.S. Census Bureau artifact, an administrative decision to aggregate people of several distinct national origins who have had differing patterns and periods of immigration to U.S. states, cities, and towns. Yet, there are renewed efforts to advocate for increased school funding for schools serving these groups.
Some of the most notable efforts have taken place in some of Connecticut’s second cities. New Britain, for example, recently obtained (some, though not nearly enough) new state funds for its schools, thanks in no small part to the city’s State Rep. Bobby Sanchez serving as chair of Connecticut’s Education Committee. In Bridgeport, groups like Make the Road are working to push local districts to secure more funds for transportation and bilingual services. And in Waterbury, groups such as Madre Latina are working to empower parents, support students going to college, and advocate for citizenship opportunities. Such local efforts cannot substitute for the substantial state legislative actions required to remedy funding disparities, but community involvement of this type may, in time, move the political needle, especially as representation within the electorate and the legislatures continues to shift.
References
Baker, B.D. (2014). America’s most financially disadvantaged school districts and how they got that way: How state and local governance causes school funding disparities. Washington, DC: Center for American Progress.
Baker, B.D. (2016). Does money matter in education? Washington, DC: Albert Shanker Institute. www.shankerinstitute.org/resource/does-money-matter-second-edition
Baker, B.D. & Corcoran, S.P. (2012). The stealth inequities of school funding: How state and local school finance systems perpetuate inequitable student spending. Washington, DC: Center for American Progress.
Baker, B.D., Sciarra, D.G., & Farrie, D. (2014). Is school funding fair? A national report card. Philadelphia, PA: Education Law Center.
Baker, B.D., Taylor, L., Levin, J., Chambers, J., & Blankenship, C. (2013). Adjusted poverty measures and the distribution of Title I aid: Does Title I really make the rich states richer? Education Finance and Policy, 8 (3), 394-417.
Baker, B.D., Weber, M., Srikanth, A., Kim, R., & Atzbi, M. (2018). The real shame of the nation: The causes and consequences of interstate inequity in public school investments. Philadelphia, PA: Education Law Center.
SchoolFinance101. (2012, June 12). America’s most screwed city schools: Where are the least fairly funded city districts? https://schoolfinance101.wordpress.com/2012/06/02/americas-most-screwed-city-schools-where-are-the-least-fairly-funded-city-districts
ABOUT THE AUTHORS

Bruce D. Baker
BRUCE D. BAKER is a professor at the Graduate School of Education, Rutgers University, New Brunswick, NJ. He is the author of Educational Inequality and School Finance: Why Money Matters for America’s Students .
Robert Cotto Jr.
ROBERT COTTO JR. is a Ph.D. student at the University of Connecticut’s Neag School of Education, in Storrs, and a lecturer in educational studies at Trinity College, Hartford, CT.


