


All these months into the pandemic, there’s no easy way to get accurate information about whether kids are going to school in person or otherwise.
However, the Census Bureau’s Household Pulse Survey (HPS), conducted every two weeks, includes state-level information that can be used to measure the percentage of parents who report that their school-aged children’s education is being disrupted.
The data and the methodology to translate them into school disruption percentages are not perfect, but the information provided is national and comes out every two weeks.
The first wave of data showed changes from May to September. The second set showed changes from May through early October. A new set of numbers shows changes from August through the end of December.
AUGUST THROUGH DECEMBER
Thanks to economist Ernie Tedeschi, who developed a method to use the HPS data to show school disruptions, we now have late August through late December numbers for every state:
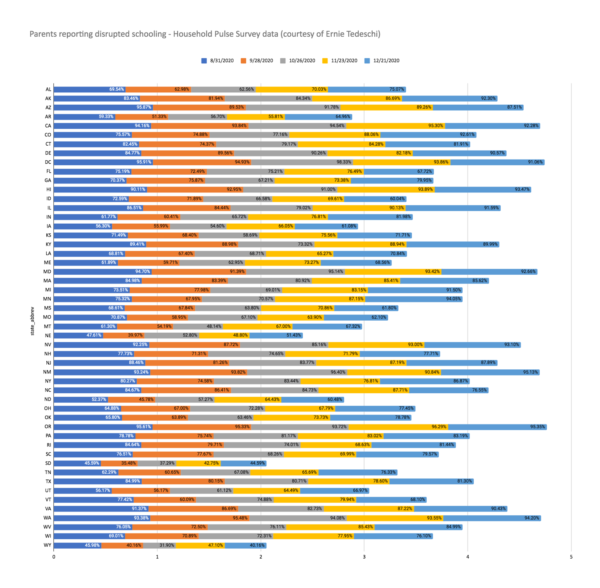
Above: Percent of parents of children enrolled in a public or private K-12 school who reported classes canceled or moved to distance learning, by state.
The August-December data show consistently high rates of school disruption reported by parents in states like California, the District of Columbia, Maryland, Oregon, Virginia, and Washington.
Much lower rates of school disruption are reported by parents in rural and western states like Wyoming, South Dakota, Nebraska, Arkansas, and Iowa.
However, the levels of disruption across the five-month period vary widely from state to state. Parents in Utah report steadily increasing levels of school disruption. Parents in Wyoming report a U-shaped pattern.
See the full-sized version of this chart here. You can access the spreadsheet here. For questions on Tedeschi’s methodology, look here.
MAY TO SEPTEMBER
As you may recall, Tedeschi published a story in the New York Times using the HPS data to show changes in the level of school disruption in various states from May to September:
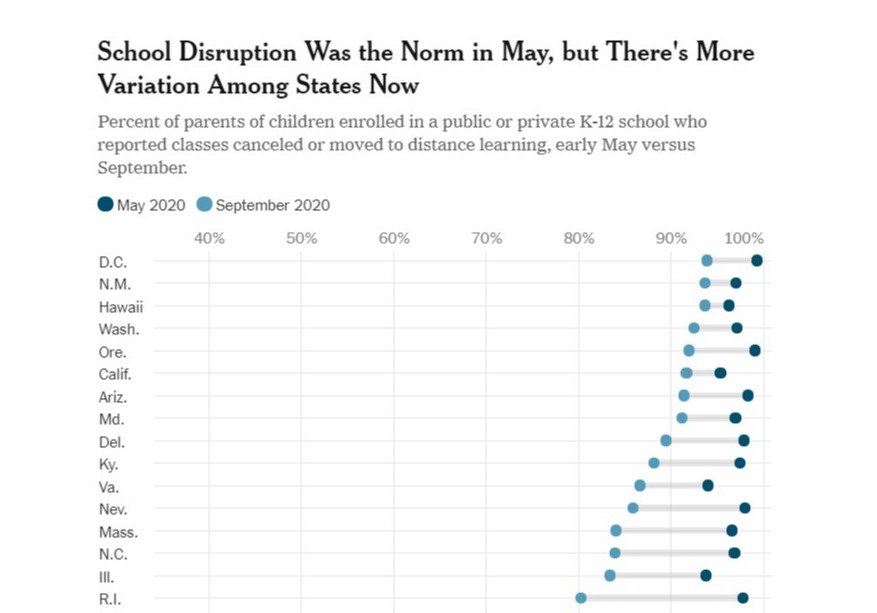
In some states, the level of disruption (presumably closed schools) remained high in September. But in 25 other states – including lots of Southern and Western states, as well as a few Midwestern and New England ones – the percentages reporting disruptions were much lower, ranging from 36 to 70 percent.
MAY THROUGH EARLY OCTOBER
A few weeks later, updated results provided by Tedeschi showed much lower school disruption levels in early October (grey) than in May (blue) or September (orange):
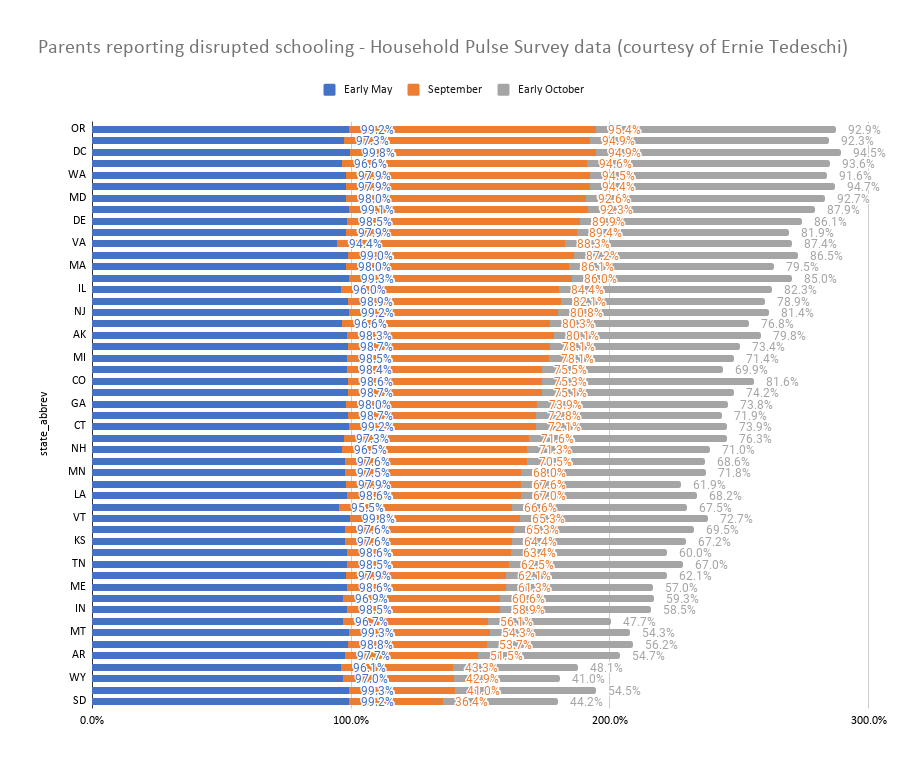
However, several states including Colorado, Connecticut, Minnesota, and Utah were reversing course, presumably going remote in response to infection rates, staffing shortages, or political issues:
For the full dataset, go here.
Previously from The Grade:
3 ways to measure school reopening trends
ABOUT THE AUTHOR

The Grade
Launched in 2015, The Grade is a journalist-run effort to encourage high-quality coverage of K-12 education issues.


