

Education research is abundant. How can school leaders use it responsibly?
Who on the front lines of schooling has time to delve deeply into education research? The answer is obvious — hardly anyone. Most state, district, or school leaders simply cannot afford to do so, given the many other pressing needs they face every day. I plead as guilty as the next. I distinctly remember the 35 minutes I spent looking at real research (data on the impact of Florida’s investments in Advanced Placement instruction) while serving as New York State’s education commissioner from 2009 to 2011. Why do I remember these 35 minutes so clearly? Because, as far as I can recall, it’s the only time I was able to reserve part of my schedule to review data that wasn’t of immediate relevance to decision making.
Part of the fault, no doubt, lies with those of us entrusted with administrative roles. We could assign staff members to give us regular, impartial briefings on relevant and important research findings. And we could insist that all major decisions about new educational inventions be subject to a research-support finding (and, in fact, the Every Student Succeeds Act, or ESSA, requires that certain uses of federal education dollars must be backed by such findings). But the truth is that for most administrators, keeping up with the research is just not a priority, and the ESSA requirement is a low bar, easily cleared.
Equally to blame is the nature of the research itself, which tends to be published in specialized journals and meant to be read by other researchers. Given the technical language, statistical lingo, and opacity of the prose, the results and implications are frequently lost on outsiders. Thus, for instance, we read of a research project assessing the impact of different math programs: “The only statistically significant predictors of a California Math adoption are the linear, squared, and cubed district enrollment variables. Thus, collectively, the covariates do not predict adoptions of California Math well” (Koedel et al., 2017).
School leaders simply don’t know what to pay attention to within the research so they avoid spending time with it at all.
This isn’t an exclusively an issue in math education. Consider the conclusions of a research paper on literacy and bilingualism: The research summary suggests that bilingual programs can be effective, but the authors add extensive cautions that undermine any clear conclusion. Among the noted issues are the fact that due to “a lack of information on correlation between dependent variables and between treatments, no multivariate analysis was conducted.” The reader untrained in statistics is unlikely to know to what degree this is a serious drawback (Reljić, Ferring, & Martin, 2015).
The study of education is not (despite protestations to the contrary) akin to the study of medicine. The human body is complex, but its complexity pales in comparison to that of the education environment, in which any number of values, aims, and variables may affect results. Even if researchers limit themselves to measuring a quantifiable education outcome, the multidimensional nature of education can undermine confidence in their results. For example, we are often told that the “gold standard” of research is the randomized control trial (RCT), where a sample from the population of interest (students, in this case) is randomly assigned to either an intervention or no intervention, with the results then compared across the two groups. But even here, there is no certainty that the results of RCTs in one context (e.g., a school or district) will be the same in a different context (e.g., a different school or district). To take but one example: When researchers at the U.S. Department of Education’s What Works Clearinghouse reviewed the existing evidence as to the effectiveness of Cognitive Tutor Algebra 1, a high school math curriculum, they discovered that one RCT had found a statistically insignificant negative result for students in five Maui schools, but another RCT, focusing on three suburban schools in Oklahoma, had found a “substantively important” statistically insignificant positive result (What Works Clearinghouse, 2016). Both studies appear to be sound — but the contexts were very different.
Yes, but . . .
These are all legitimate issues, but they don’t excuse us from the need to take research seriously. True, educational actors face major time constraints, but they want to do right by children, and research can help them accomplish that. Yes, much of the technical research is difficult to translate into accessible language, but the most important findings (such as the impact of teaching systematic phonics and phonemic awareness for reading proficiency; MacPhee, 2018) do usually “get through.” It is true that we know less for certain than we need to in order to make really secure choices among interventions — but we know a lot that can guide us. For example, we know that, on average, conventionally prepared first-year teachers are far more likely to produce low student outcomes than more experienced teachers, a fact that can inform decisions about teacher assignments (TNTP, 2012).
My colleague Robert Slavin (2019) offers another compelling reason why district leaders don’t use educational research:
My guess is that there are many district and school leaders who do not want to know about evidence on proven programs. For example, they may have longstanding, positive relationships with representatives of publishers or software developers, or they may be comfortable and happy with the materials and services they are already using, evidence-proven or not.
This may be a natural human tendency, but it is only exacerbated by the fact that school leaders simply don’t know what to pay attention to within the research so they avoid spending time with it at all — this is a problem perhaps easily solved for those willing to read on.
Stats for administrators — in 10 minutes
When reviewing research articles and reports to see whether a specific classroom intervention, tool, or teaching practice might be worth adopting, education leaders can start by considering two basic elements of every study: the effect size (which describes the intervention’s impact on student learning) and the research design.
The effect size
The great majority of education researchers report findings in effect sizes, which are often expressed in terms of standard deviations; an effect size of 0.2 simply means 20% of a standard deviation. (And what’s a standard deviation? It’s a statistical term, having to do with the consistency of the data that researchers have collected. For our purposes, there’s no need to go into the details.) The important thing to know is that effect sizes are easy to compare and interpret, no matter which kind of educational intervention is being studied: The higher the reported effect size, the better!
However, in decades of work with education school faculty and state and district school administrators, I have found two problems:
First, the great majority simply don’t know that an effect size is a standard measure of the results of an educational intervention, or that an effect size of, say, 0.20 is “better” than an effect size of 0.02. Even if they don’t understand exactly what a standard deviation is, educators can and should be able to look at two effect sizes, reported as standard deviations, and know which shows a larger effect. Such knowledge doesn’t require a statistical background, any more than you need a degree in physics to know that an object that weighs one-fifth of a pound is heavier than one that weighs one-fiftieth of a pound.
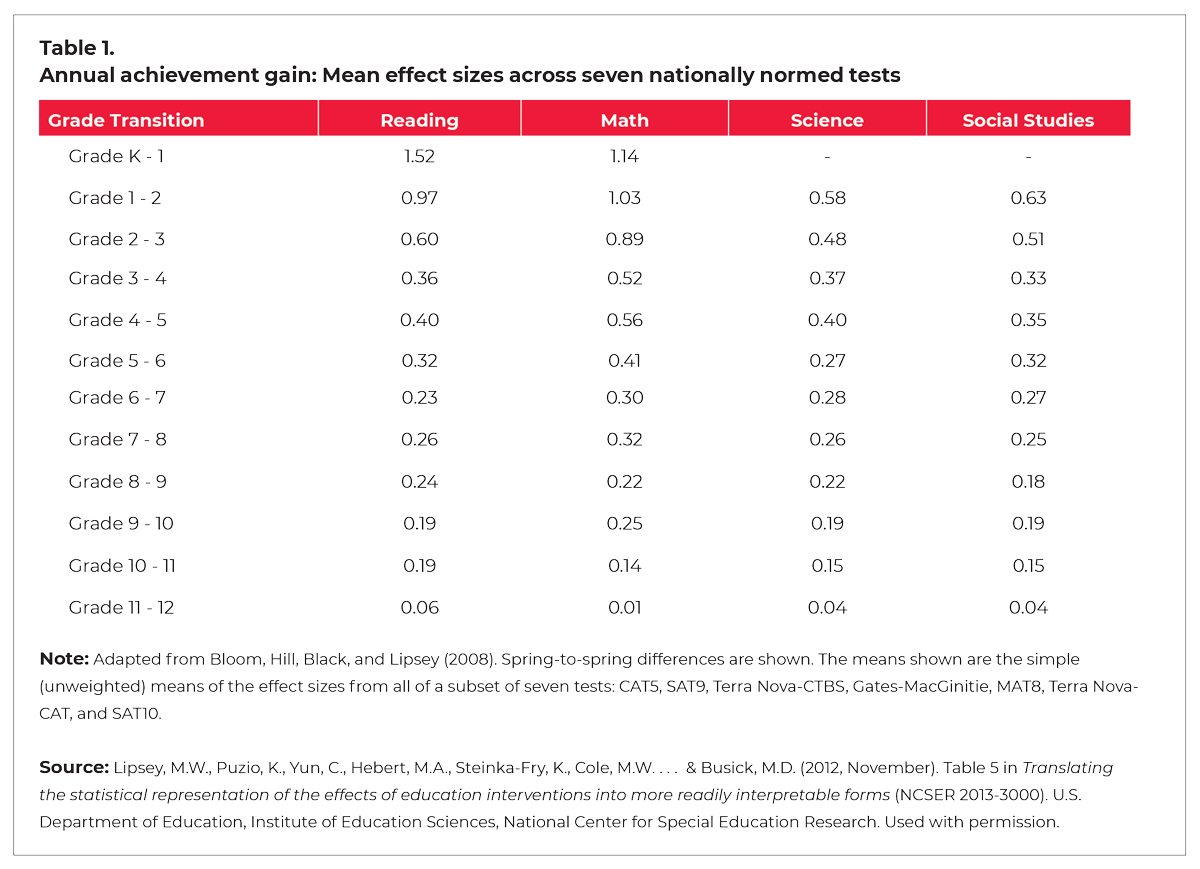
Second, few people I have spoken with outside the research community understand that an effect size, all on its own, doesn’t tell you whether you should be impressed by an educational intervention. You also have to know the intended grade-level. For instance, an intervention with an effect size of 0.2 wouldn’t make a significant difference to students in kindergarten, but it would make a huge difference for 11th graders. How can this be, you ask? Because (as illustrated by Table 1) as American students progress from grade to grade, they show smaller and smaller learning gains on standardized tests. In kindergarten, where massive annual achievement gains of 1.1 or 1.5 are the norm, an effect size of 0.2 would be a minor blip. In 11th grade, however, an effect size of 0.2 represents a huge improvement, akin to an entire extra year’s worth of learning. If you step back and consider how rapidly young children develop, compared to their older siblings, this shouldn’t come as a surprise. But still, most educators don’t understand that effect sizes must be understood in relation to this grade-level learning context. And until they do, they’ll struggle to make sense of most education research studies.
The research design
So, let’s say that a research study finds that a particular classroom intervention has an impressive effect size, given the grade level it’s designed for. That’s a study we can count on, right? Not quite so fast. The second issue to bear in mind is the kind of research used to produce that pesky effect size. Broadly speaking, there are three different kinds of research, which I describe here in ascending order of “you should take this seriously”:
Correlational studies. The effect size from a correlational study describes the extent to which an intervention was associated with a change in student outcomes; it doesn’t suggest that that the intervention caused the outcome. By way of analogy, imagine that a correlational study finds that married people are less likely to develop cancer. Does that mean that this intervention (getting married) is an effective way to bring about this desirable outcome (protecting oneself from getting cancer)? Not at all. The data don’t tell us why these two variables are associated with each other. Maybe people who are already living healthier lives are more likely to get married. Or maybe married people are more likely to live in the suburbs, where there’s less exposure to cancer-causing pollution. At this point, we can only speculate. We simply don’t know what explains the correlation we’ve found, only that it exists.
Quasi-experimental studies. In this sort of study, researchers start with data that have already been collected, and then they look to see whether they can find any significant differences in outcomes among the people who were studied, related to the different experiences they had. For example, suppose 1,000 4th graders take a test at the beginning of the school year to see if they qualify for extra math support. A quasi-experimental study might involve looking back, a year later, to compare the 4th-grade math achievement gains of students who just barely qualified for the intervention to those that just barely missed qualifying — that should reveal just how much of a difference the extra support made for the students who received it.
Still, though, because the comparison groups weren’t entirely similar (their scores on the diagnostic test differed somewhat), and because the researchers can’t be sure that no other factors influenced the outcomes (perhaps some teachers decided to take it upon themselves to tutor students who missed out on the extra support), we can’t be entirely confident in the research findings. In short, the effect size from a quasi-experimental study should be interpreted as showing the degree to which the intervention (extra math support) plausibly caused a change in outcomes (slightly greater gains for the participating students).
A randomized control trial (RCT) study. While a quasi-experimental study involves looking back at data that have already been collected, an RCT allows researchers to control the data-collection process from the start. After recruiting two groups of students and/or teachers that are very similar to each other (in terms of age, race, family income, school size, and other factors), they will randomly assign one group to receive the intervention and the other not to. Then, provided that no unexpected events (e.g., a hurricane, a teacher strike, or the introduction of a new curriculum at one of the schools) have skewed the data, they can measure the effects of the intervention itself. The effect size from a RCT, then, expresses the degree to which the intervention caused a change in outcomes.
Although I’ve listed these in ascending order of how seriously educators should take them, there are exceptions. For example, a larger-scale study is preferable to a smaller one, meaning that a small RCT in an unusual district may not be as reliable as a large quasi-experimental study from many states or districts.
Almost there!
So, let’s say that your team recommends an intervention with a strong effect size that is based on RCT research. Time to say yes? Not quite.
By now, some readers will be muttering to themselves about “statistical significance.” Put simply, statistical significance is the likelihood that the outcomes observed in the research are due to mere chance. Here, the lower the number (delightfully called a “p-value”) the better. For example, a p-value of 0.02 means there is only a 2% likelihood that the observed results were a fluke, having nothing to do with the given intervention. (Or, to frame things more positively, it means there’s a 98% likelihood that the intervention was responsible for the results.) One thing to bear in mind, though, is that the larger the sample of subjects, the more likely the study will have a lower p-value (i.e., greater statistical significance). The larger the sample size, the more accurately it is expected to mirror the larger population, with individual flukes and outliers having less and less impact on the overall shape of the data.
In general, researchers will advise you to be skeptical of interventions if the data that supports them, no matter how positive in other ways, is not statistically significant. However, reasonable people can disagree as to what they consider to be statistically significant. That’s precisely why sophisticated educational leaders should make a point of checking the p-values of research studies. The most common cut-off point for statistical significance is a p-value of 0.05, meaning there is a 5% chance that intervention had no effect. However, for a superintendent, a p-value of 0.1 or even 0.15 (meaning a 90% or 85% likelihood that it made a difference) might be perfectly acceptable.
Enough already: What about my $s?
You now know more about research findings than the 95% of educational administrators who haven’t read this piece. But nothing in education is free — interventions cost money. So, what you really want is an intervention that fits this description:
The research behind it is an RCT study conducted with large numbers of subjects with a low p-value (ideally below 0.5) and a high effect size (high enough to make a real difference for the students you have in mind), that also is dirt cheap!
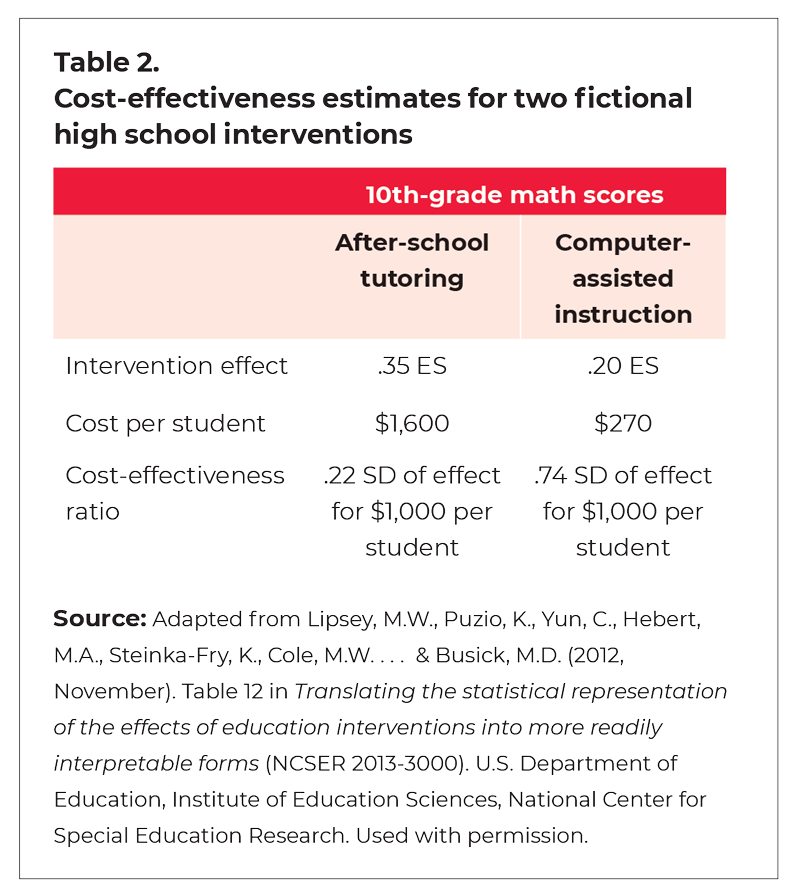 There may be cases where one intervention appears more likely to be effective but is considerably more costly than a less effective intervention. Here you’ll need to consider the ratio of cost to effectiveness. One research paper I know of (Lipsey et al., 2012) does a nice job of showing this in concrete (although fictional) terms. Table 2, adapted from that paper, shows a comparison between two possible interventions to improve students’ math performance. By combining the impact of the intervention (the effect size) with the cost per-student of the intervention, the researchers provide what policy makers most need — namely, the findings to make an informed decision between the two possible investments.
Note that in this hypothetical example, after-school tutoring, with an effect size of .35, is hands down the more effective intervention in comparison to computer-assisted instruction, with an effect size of .20. But because the latter is so much cheaper, the cost-effectiveness ratio would favor the computer-assisted intervention.
And now you know exactly what to ask your team when they come to you looking for permission to invest in a new research-based program, tool, or curriculum: What’s the effect size? For what grade level? What kind of study was it? What’s the p-value? And how cost-effective is it? Once you know those details, you’re ready to choose your interventions wisely.
References
Koedel, C., Li, D., Hardaway, T., & Wrabel, S.L. (2017, February). Mathematics curriculum effects on student achievement in California. AERA Open.
Lipsey, M.W., Puzio, K., Yun, C., Hebert, M.A., Steinka-Fry, K., Cole, M.W. . . . & Busick, M.D. (2012, November). Translating the statistical representation of the effects of education interventions into more readily interpretable forms (NCSER 2013-3000). U.S. Department of Education, Institute of Education Sciences, National Center for Special Education Research.
MacPhee, K. (2018, August 15). The critical role of phonemic awareness in reading instruction. Scholastic EDU.
Reljić, G., Ferring, D., & Martin, R. (2016, March). A meta-analysis on the effectiveness of bilingual programs in Europe. Review of Educational Research, 85 (1).
See, B.H., Gorard, S., & Siddiqui, N. (2015, July). Word and World Reading: Evaluation report and executive summary. Education Endowment Foundation.
Slavin, R. (2019, October 10). Do school districts really have difficulty meeting ESSA evidence standards? Robert Slavin’s Blog.
TNTP. (2012, March). Teacher experience: What does the research say. Author.
What Works Clearinghouse. (2016, June). WWC intervention report: Cognitive tutor. U.S. Department of Education.
This article appears in the November 2021 issue of Kappan, Vol. 103, No. 3, pp. 43-47.

ABOUT THE AUTHOR

David Steiner
DAVID STEINER is the executive director of the Institute for Education Policy and a professor in the School of Education at Johns Hopkins University, Baltimore, MD.


