

Allison Shelley for EDUimages (CC BY-NC 4.0)
Conflicting and incomplete data make it difficult to get a clear nationwide picture of the future teacher workforce.
What the teacher workforce looks like in the future will largely be determined by the kinds of people who are progressing through the early teacher pipeline. Broadly speaking, this early teacher pipeline can be defined as spanning the point at which individuals take their first definitive steps toward a career in teaching, usually by enrolling in a teacher preparation program or taking a basic licensure test, to the point at which they are fully credentialed and eligible to teach. (The specifics can vary across states for many reasons, such as the timing of licensure tests and entry into preparation programs, as well as the nature of the programs themselves.) While teacher preparation and licensing requirements are determined at the state level, there are myriad reasons to be interested in nationwide data about both the number and types of people who are pursuing a teaching career.
Why national data matter
First, the quality of the teacher workforce has clear implications for the social and economic health of the country, and gaining a better understanding of why candidates across the country decide to pursue teaching is key to influencing what the teacher workforce will look like. This is particularly important today because signals show a declining interest in the teaching profession. In 2018, for the first time, a majority of parents surveyed in the PDK poll stated that they did not want their children to pursue teaching as a career (PDK International, 2018). Research has yet to form a consensus about the degree to which interest in teaching is driven by education policies, such as school or teacher evaluation and tenure reform (Kraft et al., 2020), economic factors in teaching and competing occupations (Blom, Cadena, & Keys, 2015; Nagler, Piopiunik, & West, 2020), or other factors. We need a national picture to help us learn more about those who are on the path into teaching and why they persist in or drop out of that path.
We need a national picture to help us learn more about those who are on the path into teaching and why they persist in or drop out of that path.
Second, teacher labor markets differ substantially by state, yet debates about the teacher pipeline often play out nationally, even while using data from selected states to make a point. For example, a 2015 New York Times article (Rich, 2015) described a teacher credentialing and enrollment slowdown in California, then sounded an alarm about nationwide teacher shortages. Simply put, it’s a mistake to draw strong conclusions about the national environment based largely on data from just one state (or a few states) that may not be representative of the teacher labor market writ large.
Similarly, considerable attention has come to focus on efforts to diversify the teacher workforce, in light of data showing that while students of color make up nearly half of all public school students, teachers of color make up less than 20% of teachers nationwide (Goldhaber, Theobald, & Tien, 2015). But states differ substantially in the diversity of their teachers and teacher pipelines, and it would be easy to be misled about the national picture if we assumed that a particular state or states were representative of the country as a whole.
Finally, while governance of the teacher labor market and entry requirements is largely a state function, there are federal policies that target the early teacher pipeline. The TEACH grant, for example, which has been in place since the 2008-09 school year, provides federal student aid aimed at encouraging students to serve as highly qualified teachers in high-need fields for schools with low-income student populations. And, more recently, President Joe Biden’s administration has, in its American Families Plan, called for a “$9 billion investment (over 10 years) in America’s teachers, addressing shortages, improving training and supports for teachers, and boosting teacher diversity” (U.S. Department of Education, 2021). Judging the efficacy of these efforts requires a national picture of the early teacher pipeline.
The problem with national data
Getting a detailed nationwide picture of the early teacher pipeline turns out to be much more challenging than one might guess. There are only two national sources of annual information on the number of individuals pursuing a teaching credential: (1) Title II reports, which focus narrowly on the enrollment of individuals in teacher preparation programs (TPPs) and whether they complete their programs’ requirements; and (2) the Integrated Postsecondary Data System (IPEDS), which focuses more broadly on the number of college students by areas of study.
Unfortunately, these two data sources provide an incomplete and sometimes contradictory picture of the early teacher pipeline. Both Title II and IPEDS measure the number of candidates enrolled in and completing their education in TPPs. But each uses different definitions of TPP enrollment and completion, making the datasets difficult to synthesize. Depending on a teacher candidate’s particular pathway, they could be included in one dataset but not in the other. (For a detailed analysis of the issues, see Goldhaber & Holden, 2021).
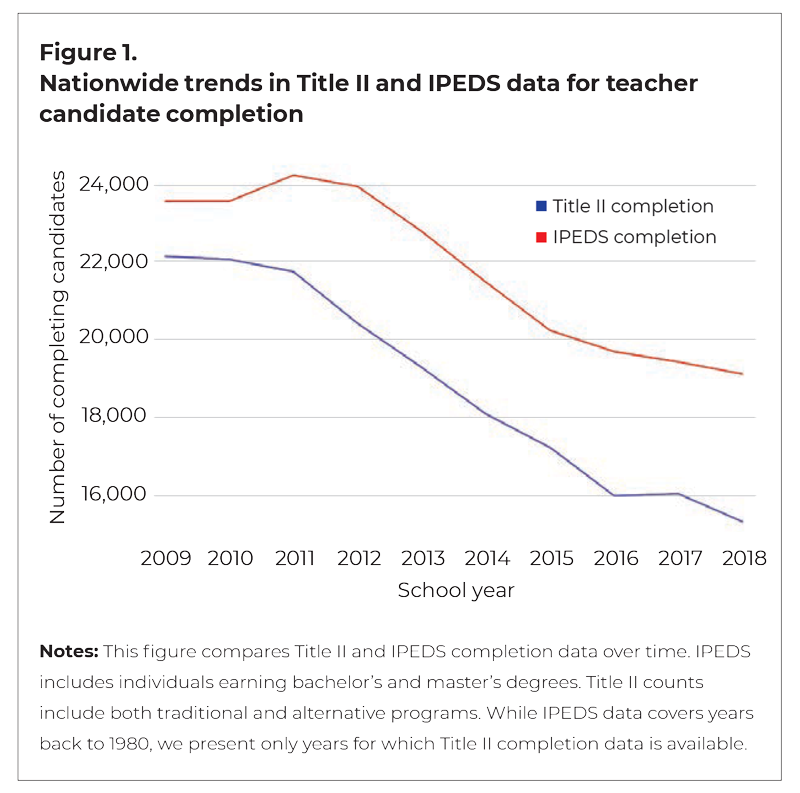
The good news is that, at a high level, the datasets agree, at least when it comes to trends in the numbers of teacher candidates completing their programs over time. As detailed in Figure 1, both datasets show declining completions between 2009 and 2018. However, there is also a sizable gap between the number of completions represented by the two measures, amounting to 15,000 to 40,000 teacher candidates per year. Typically, about 100,000 to 150,000 novice teachers are hired each year (Cowan et al., 2016), so this gap is the equivalent of 10% to 40% of all positions that are filled by novice teachers annually.
The two datasets also are inconsistent in terms of what is happening across individual states. Figure 2 shows the percent change from 2010-11 to 2014-15 in completions for the two datasets in each state. As shown in Figure 1, this period represents the sharpest nationwide decline in completions and a period where the two datasets tend to agree in terms of trends, and both measures follow similar trends at the national level. The overall percentage of change (represented by horizontal lines in Figure 2) are similar (about 12% for IPEDS and 16% for Title II). However, when we look at individual states, there are sometimes large differences in the amount and direction of change in the two datasets, represented by the vertical distance in the blue (Title II) and red (IPEDS) dots in Figure 2.
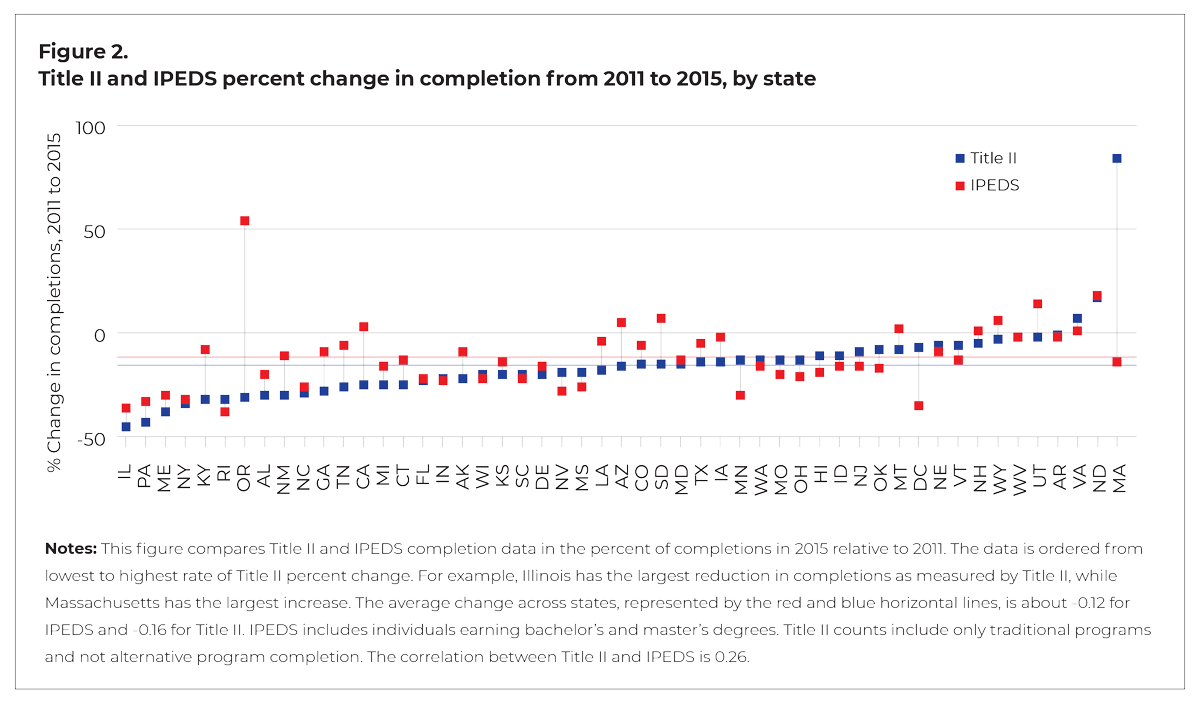
Indeed, there are some cases where the state-level measures contradict each other about whether program completion has increased or decreased. In California, for example, Title II reports a decline of about 25% while IPEDS reports an increase in completions of about 3%. So whether more or fewer people are preparing to teach in California (or Oregon, Arizona, or Massachusetts) depends on which data source you consult. And there is not a consistent pattern regarding which measure is more likely to show increases or decreases across states. These contradictions and lack of consistency could have serious implications for understanding the reasons for changes in new teacher supply and for states wishing to consider how these changes relate to their teacher preparation and licensure requirements.
Why the differences?
There are several explanations for how discrepancies could arise between these datasets, and they illustrate some of the weaknesses in our national data about the early teacher pipeline.
Double counting. IPEDS does not distinguish between teacher candidates who are seeking their first license and current teachers seeking more advanced credentials. In contrast, Title II reporting focuses on teacher candidates who are seeking their initial licenses. And because IPEDS tracks degrees instead of individuals, a student receiving two education degrees could hypothetically be counted twice. IPEDS would thus tend to inflate the number of individual teacher candidates.
Alternative TPPs. It is not clear how alternative programs are counted in the data, but there’s reason to believe that it’s not consistent either across datasets or across states. In particular, IPEDS staff have informed us that the decision to include candidates in alternative programs housed at institutes of higher education is made by the institutions themselves (IPEDS Help Desk, personal communication, February 27, 2020). And the definition of what counts as an “alternative” program can differ from state-to-state (National Academies of Sciences, Engineering, and Medicine, 2020).
Definition of program completion. When determining how many candidates have completed a preparation program, IPEDS counts education degrees conferred, while Title II counts those who passed in-state licensure examinations (Putman & Walsh, 2019). Some individuals may receive education degrees without seeking a license or passing the necessary licensure examinations, and they would be counted as completions in IPEDS but not Title II. Title II may also undercount completions if teacher candidates finish their education degrees in one state but seek licensure in another. Together, these two factors would suggest that IPEDS would report more completions than Title II. But that’s not necessarily the case. In some states, teacher candidates pursue teaching as a minor rather than a major degree, and these would not appear in IPEDS data but could appear in Title II, raising the possibility of an undercount in IPEDS. In short, we cannot be certain whether one data source is more likely to inflate or undercount the number of teacher candidates, because the reasons behind the differences in their data flow in both directions.
Getting a more comprehensive picture
The differences between these two datasets show how difficult it is for researchers and policy makers today to pin down precisely what the early teacher pipeline looks like. Examining one dataset versus the other could easily lead one to reach a different conclusion about the number of individuals preparing to teach. But the problem is worse than this. For instance, while Title II is arguably the better dataset to use in determining the specialization of individuals preparing to teach, it has only recently begun collecting information on the race and ethnicity of teacher candidates who are enrolled in TPPs, and it does not report the race and ethnicity of graduates. Thus, it is not terribly useful for understanding race and ethnicity gaps between enrollment and completion. And, as discussed above, the definition of alternative programs is left up to states, meaning there is limited ability to get a clear and consistent picture of how the number of individuals entering the profession through alternative programs varies across states or over time.
But it doesn’t have to be this way.
Resolving discrepancies and getting a much clearer national (and state-by-state) perspective on what the early teacher pipeline looks like is not complicated and may not be terribly costly. Slightly modifying the surveys used to collect IPEDS and/or Title II data could address many of our concerns. For example, IPEDS survey questions could provide clear direction to institutions about whether to include alternative programs, and the scope of IPEDS surveys could be expanded to cover alternative programs. IPEDS could also collect information on whether individuals are in the process of continuing their education or pursuing their first degree in their field of study.
Beyond providing clarification about the number of candidates completing preparation programs, the data could also be improved to answer questions about how individuals progress through teacher education. Longitudinal tracking of teacher candidates while enrolled in TPPs would eliminate problems like double counting and could help researchers pinpoint where prospective teachers are entering or exiting the pipeline. Having better data would allow policy makers and researchers to better link preservice experiences to in-service teacher outcomes and to assess how factors such as education costs interact with pay and working conditions to affect prospective and novice teachers’ decisions about their career. To this end, states could work to collect and integrate data from teacher preparation programs into state longitudinal data systems.
The bottom line is that existing data sources do not provide a clear national picture of the early teacher pipeline, and we believe such a picture is necessary for answering fundamental questions about the supply of tomorrow’s teachers. Thus, we urge policy makers to consider ways to modify existing data collections about prospective teachers to provide a clearer picture. If we are serious about building the nation’s prospective teacher workforce, then we need more comprehensive and useful data to measure where we are, determine where we want to go, and assess what progress we’re making along the way.
References
Blom, E., Cadena, B.C., & Keys, B.J. (2015). Investment over the business cycle: Insights from college major choice. Journal of Labor Economics, 39 (4).
Goldhaber, D.D. & Holden, K. (2021). Understanding the early teacher pipeline: What we can (and, importantly, can’t) learn from national data (CALDER Policy Brief No. 21-1120). American Institutes for Research.
Goldhaber, D., Theobald, R., & Tien, C. (2015). The theoretical and empirical Goldhaber, D., Theobald, R., & Tien arguments for diversifying the teacher workforce: A review of the evidence. University of Washington Bothell, The Center for Education Data & Research.
Kraft, M.A., Brunner, E.J., Dougherty, S. M., & Schwegman, D.J. (2020). Teacher accountability reforms and the supply and quality of new teachers. Journal of Public Economics, 188.
National Academies of Sciences, Engineering, and Medicine. (2020). Changing expectations for the K–12 teachers: Policies, preservice education, professional development, and the workplace. The National Academies Press.
Nagler, M., Piopiunik, M., & West, M.R. (2020). Weak markets, strong teachers: Recession at career start and teacher effectiveness. Journal of Labor Economics, 38 (2), 453-500.
PDK International. (2018). Teaching: Respect but dwindling appeal: The 50th annual PDK poll of the public’s attitudes toward the public schools. Author.
Putman, H. & Walsh, K. (2019). A fair chance: Simple steps to strengthen and diversify the teacher workforce. National Council on Teacher Quality.
Rich, M. (2015, August 10). Teacher shortages spur a nationwide hiring scramble (credentials optional). The New York Times.
U.S. Department of Education. (2021). Fiscal year 2022 budget summary. Author.
This article appears in the November 2021 issue of Kappan, Vol. 103, No. 3, pp. 13-16.

ABOUT THE AUTHORS

Dan Goldhaber
Dan Goldhaber is the director and vice president of the National Center for Analysis of Longitudinal Data in Education Research at the American Institutes for Research and the director of the Center for Education Data and Research and a professor in the School of Social Work at the University of Washington.
Kristian L. Holden
Kristian L. Holden is an economist at Amazon, Seattle, WA.


