

The lack of reliable information is contributing to this fall’s conflicting coverage. Three datasets out there, though imperfect, might help.
By Alexander Russo
Confusion and conflict have marked school reopening coverage this fall, with seemingly little agreement on what the story is or how to cover it.
The reasons are obvious. In many places, remote learning is a mess, and district plans keep changing. Journalism itself is a tougher job these days, as reporters try to work from home while the industry is melting down.
In addition, some of the most important tools for reporting the issue are missing. The lack of authoritative data on COVID cases in schools means reporters have to rely on anecdotes rather than a broad, informative view of outbreaks at school. Even worse, no one even knows how many students across the nation are attending in-person classes, full or part time, or how quickly those numbers are changing.
Are school reopenings isolated, growing, or declining? There’s lots of anecdotal information, and there have been some fascinating snapshots correlating reopening and political views. But nobody seems to have the full picture in an ongoing, systematic way.
Last week, however, I learned about a source of information that might help. It’s called the Household Pulse Survey, and it’s published by the Census Bureau.
While imperfect, it and two other private databases are the best we have right now. I hope more journalists will consider the available information, however many caveats may be required.
To learn more about how the media covers education, follow The Grade on Twitter and Facebook.

Above: Last spring’s school closings map by EdWeek was enormously helpful to policy makers and journalists.
As difficult and scary as last spring was, at least we knew what was going on in terms of whether schools were open or closed.
That’s largely because EdWeek provided an invaluable service mapping district shutdown dates — a resource that nearly everyone in education journalism used.
From March through May, EdWeek updated its district and states maps. The service was so widely used that we wrote a story about it, Making the map: How EdWeek devised a must-have pandemic resource.
There was lots of debate over whether systems had closed earlier or later than they should have, or how quickly they were able to revamp their operations remotely. There was some debate about whether schools should have closed in the first place. But nobody was arguing over how many schools had been closed, or when.
This fall, it’s been an entirely different story. The coverage has been all over the place. Partly this has been because of changes in community infection rates and the ever-changing plans of districts like Chicago and Boston and New York City. But the confusion has also resulted from the lack of a uniform way of measuring student participation across districts and states.
In the absence of solid information, news outlets are forced to use convoluted language to try to capture what’s happening, mixing available anecdotal information about districts’ current and future plans.
“Public schools that opened for in-person learning this month, or plan to, range from suburban districts in North Carolina’s Wake County to city systems such as Indianapolis; Des Moines, Iowa; and Miami-Dade in Florida,” reported the Wall Street Journal last month. “Schools in Houston plan to welcome students inside starting Monday.”
“Of the 10 largest school districts, six—Miami-Dade, Broward, Orange, and Hillsborough, all in Florida, plus Houston and New York City—are offering, or plan to offer, in-person instruction to some or all grades by the end of the month,” reported Education Week last month.
The coverage rarely lines up very well for readers.
Over the weekend, USA Today reported “the majority of the 15 largest districts in the nation now have at least some students in school buildings.”
On Monday, the New York Times reported that New York City was “one of the few large urban districts in the United States to offer any classroom instruction.”
![]()
Above: According to the latest Burbio tracker, 38% of U.S. K-12 students are attending schools where traditional in-person education is offered (deep purple).
Unlike in the spring, there’s nobody to save us.
EdWeek tried to repeat its school shutdown effort, charting first-day instruction plans for nearly 1,000 districts. However, the page focused only on initial reopening plans, not subsequent changes, and it shuttered at the end of September. Many districts’ plans have changed since then.
And, as reported in US News, there’s no reopening data coming out of the federal education department anytime soon.
All is not lost, however. There are at least three ways to try to measure the reopening process. None of them is ideal. Each is imperfect and should be used carefully; the data seemingly conflict in major ways. But they may help you and your readers understand what’s going on.
The first is a company called Burbio, whose figures have already been used by a variety of news outlets. It bases its findings on a sample of districts nationwide, weighted to make the numbers representative of the nation, and updates its findings in a weekly email full of useful tidbits and links.
According to Burbio, 38 percent of students attend schools offering traditional in-person learning every day.
The second source is MCH Strategic Data, which has produced a reopening map that has also been used by a variety of news outlets. Its website features national trends, and some additional details about patterns of safety protocols being used.
According to MCH, 19 percent of districts offer on-premise classes.
Sign up here for the week’s best education news and newsroom comings and goings.

Above: According to the MCH tracker, 19% of districts plan to offer on premises classes (in red).
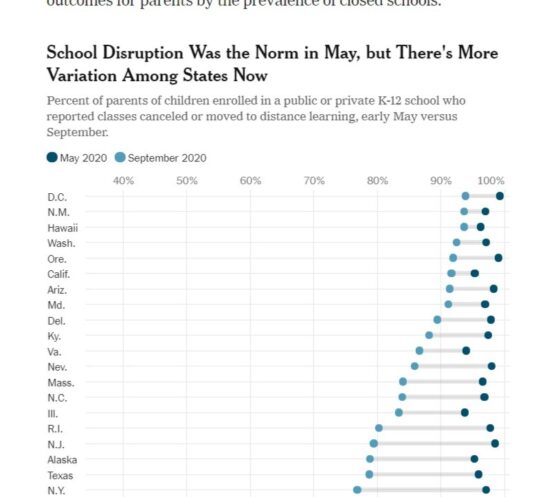
The third potential information source is the Census Bureau’s Household Pulse Survey, whose application to this issue I realized only when I came across a chart in the New York Times last week, showing state-by-state percentages of parents of children enrolled in a public or private K-12 school who reported classes canceled or moved to distance learning, early May versus September.
According to the data produced using the Census information, state-level “disruptions” of traditional education in September ranged from a low of 36 percent to a high of 94 percent.
In eight areas — D.C., N.M., Hawaii, Wash., Ore., Calif., Ariz., and Md. — 90 percent or more of parents reported their children’s education was disrupted. However, in 25 other states – including lots of Southern and Western states, as well as a few Midwestern and New England ones – the percentages reporting educational disruptions were much lower, ranging from 36 to 70 percent.
The Times piece, by economist Ernie Tedeschi, produced these findings using data from the Household Pulse Survey. According to Tedeschi, this data might be used to come up with a national number, city-specific information for some of the biggest metropolitan areas (where available), and as demographic breakdowns for remote learning by parents’ race, age, etc. You can see his methodology here.
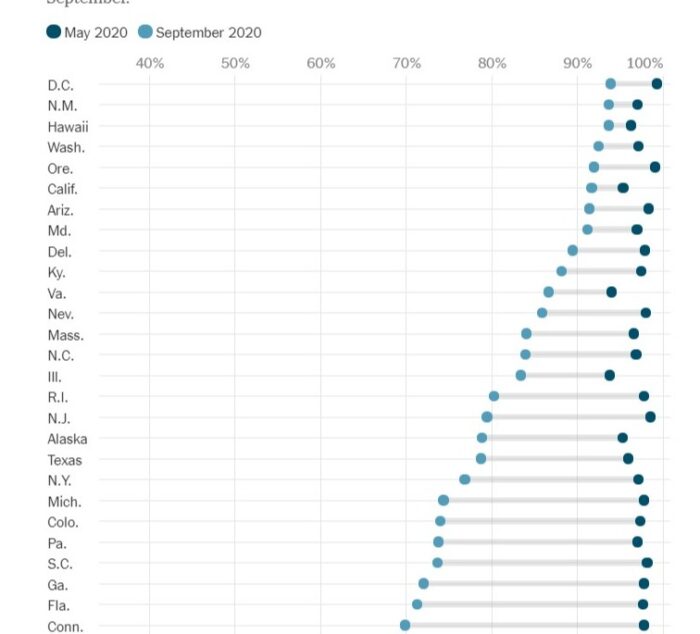
Above: According to last week’s New York Times, using Census Bureau data, the percent of parents of children enrolled in a public or private K-12 school who reported classes canceled or moved to distance learning varies widely by state.
Like the others, this data set isn’t perfect, by any means. And the results from these different sources don’t line up very well. But they’re better than nothing, and until something better comes along I hope journalists will consider using them to help tell the difficult school reopening story this winter.
Previous coverage:
Journalists’ strategies for covering the school reopening story
Fall 2020 schools coverage turns a corner
What makes school reopening so challenging to cover?
ABOUT THE AUTHOR

Alexander Russo
Alexander Russo is founder and editor of The Grade, an award-winning effort to help improve media coverage of education issues. He’s also a Spencer Education Journalism Fellowship winner and a book author. You can reach him at @alexanderrusso.
Visit their website at: https://the-grade.org/


