

A teacher’s feedback diet is incomplete without the perspectives of students.
Definitions of what it means to eat a “breakfast of champions” have evolved considerably over time, ranging from coffee and a cigarette to a bowl of Wheaties cereal with whole milk to more contemporary versions that include flaxseed waffles, avocado toast, and Berry Divine acai bowls. Whatever the menu, the idea is that a good breakfast is the foundation of a good day.
Similarly, in the world of organizational leadership, Ken Blanchard has contended that “feedback is the breakfast of champions” (Blanchard, 2009; Blanchard & Spencer, 1982), and it should include comprehensive, rich data that is collected, prepared, and consumed systematically, digging into the evidence. That’s the kind of feedback that nourishes professionals as they seek to improve themselves.
That goes for the professionals who work in schools, too. However, we believe that educators in general, and teachers in particular, rarely get as much useful feedback as they might want, and certainly not as much as they might need, to help themselves become champion accomplished teachers. Moreover, while many teachers are routinely observed, evaluated, and coached by other adults, they hardly ever receive formal feedback from their students. And this — useful evidence, solicited in real time from the attentive, perceptive, and astute students with whom they interact daily — can provide the most nourishing feedback of all.
Assembling a meal of multiple measures
Since former President Barack Obama’s Race to the Top grant competition was enacted in 2009, federal- and state-level teacher evaluation and accountability policies have been hyper-focused on gathering indicators of teacher quality and effectiveness via two key, albeit overly cooked measures: 1) teachers’ purportedly causal impacts on their students’ learning, as measured by growth in students’ large-scale standardized test scores over time (i.e., teachers’ “value-added”), and 2) observations of teachers in practice, often conducted by their supervisors using observation rubrics, such as the popular Danielson Framework for Teaching (Ferguson & Danielson, 2014).
The first measure is notably controversial, both in the academic research and in practice. Indeed, value-added measures have been at the foundation of multiple lawsuits in which plaintiffs (primarily teachers) have sued their states or districts for unsubstantiated and indefensible uses (and abuses) of said teachers’ value-added data, including for allegedly wrongful teacher terminations (Sawchuk, 2015).
Student survey instruments elicit information from the people who have the most up-close and in-depth knowledge of what teachers do in the classroom each day.
The second measure, observations of teachers in practice, has been the standard measure of teacher quality for decades and is more popular among educators. But it, too, is controversial. For example, evidence suggests that observers often fail to differentiate effectively between “good” and “bad” teachers and that they often give certain teachers higher ratings than others because of factors — such as unconscious bias or personal friendships — that have nothing to do with those teachers’ instructional abilities (Weisberg et al., 2009).
Another problem with teacher observations is that most if not all observation rubrics currently in use are research-situated rather than research-based. That is, the rubric items, components, and domains that make up the observation rubrics have been taken directly from the research literature — reflecting somebody’s theory about what good teaching entails — rather than being developed, piloted, and modified in real-world settings, all while carefully assessing said instruments’ reliability, validity, and bias. Indeed, evidence suggests that some prominent observation measures have always yielded biased data and still do so, even though they’ve been used and (supposedly) refined and improved over a span of decades. Often, they skew teachers’ evaluations based on the types of schools in which they teach and the types of students they serve. For example, the higher the aggregated levels of student achievement, the more prevalent the bias in favor of teachers; and the more economically disadvantaged the students, the more prevalent the bias against teachers, regardless of their actual levels of teaching quality (Steinberg & Garrett 2016; Whitehurst, Chingos, & Lindquist, 2014).
Despite these known shortcomings of both value-added and observation-based measures, researchers and policy makers continue to recommend that these metrics be used to evaluate teachers and provide feedback on their practice. We don’t think schools should necessarily abandon these approaches entirely. Indeed, they can and should be used in context and with adequate understandings about their limitations. Rather, we argue that schools can get a more complete and less biased picture of teachers’ practice by supplementing these measures with another one, in short, by adding students’ perceptions of their teachers to the mix (Kane & Staiger, 2012).
With a satisfying side of student feedback
Student survey instruments have been used for decades, giving students — who observe teachers in practice daily — a way to assess the social, emotional, and instructional qualities teachers bring with them into their classrooms. As skeptics will likely point out, they’ve been used mostly in higher education settings, to evaluate college instructors and course quality. But they have become increasingly common in K-12 education as well, and they show promise as a useful source of feedback at this level, too.
As of 2019, seven states required student survey instruments to be used as part of teacher evaluation and accountability systems in K-12 schools, and an additional 24 states and the District of Columbia permit but do not require their use (Walsh & Ross, 2019). Because this has been a recent development, studies on student surveys in K-12 settings have yet to substantively contribute to what we know about these measurement and feedback tools, but a body of research is beginning to develop (Rollett, Bijlsma, & Röhl, 2021a). What we’ve learned so far suggests that survey measures are not perfect at assessing teacher quality and identifying how teachers can improve, but they can help to round out the data we get from value-added and observational measures — in effect, they add nutritional balance to the breakfast. Recent research (Geiger & Amrein-Beardsley, 2020; Rollett et al., 2021b) details both the benefits of using student survey data in K-12 settings, as well as some of its limitations.
What are some of the benefits? For one thing, student survey instruments elicit information from the people who have the most up-close and in-depth knowledge of what teachers do in the classroom each day — students. They also yield more reliable estimates of teacher effects than do teachers’ value-added and classroom observation data, meaning that results derived through student evaluation instruments yield stable results on which teachers are consistently good, average, inadequate, and the like.
Further, surveys can be administered efficiently and at relatively little cost. And, especially in comparison to value-added measures, student surveys yield timely, useful, and actionable data, allowing teachers to promptly adjust their pedagogical practices and behaviors in real time. The feedback teachers receive from surveys tends to be much more specific and actionable than testing data, especially when surveys are designed to focus on facets of teaching that actually matter to students. In this way, student surveys are akin to observation feedback — both can focus on specific practices that matter in the moment.
But like any measure, student surveys have limitations, too. Students’ evaluations of teachers are likely to be biased against certain teachers based on a variety of factors, including class sizes; teachers’ race, gender, and other demographics; the interaction of teachers’ demographics with students’ demographics (e.g., students’ race, gender, age); how students personally feel about their teachers, unrelated to their instructional or pedagogical skills; students’ expected grades; students’ perceptions of course difficulty; the number of students surveyed; and students’ willingness to take surveys seriously. Also, when reviewing student survey data, it’s important to recognize the limited knowledge students bring to the surveys. Early elementary students, for example, are not typically capable of evaluating what good teaching actually means and looks like, and students at all levels may not be capable of determining how well a teacher knows the content. Finally, and like every other kind of survey, student surveys can’t include too many questions, or else people will refuse to complete them. And as a result, each survey can only capture some facets of effective teaching.
Given these benefits and limitations, there’s good reason to be cautious when using student survey data, especially for summative or consequential purposes. If surveys are used to make decisions about salary, for example, issues of reliability, validity, and bias become much more important. However, when student surveys are used for formative purposes, the feedback they offer can be a powerful driver of change, especially when teachers are permitted (and encouraged) to think carefully about what the data do and do not show, how they should interpret the results (given the specific context), and what they can learn from those results to better themselves as teachers and professionals.
A recipe for survey success
We close with a few best practices for developing effective surveys to elicit data that nourish teachers and their practice. However, we’re assuming some basic familiarity with survey design — readers who are entirely new to this topic should also seek out more detailed guidance on how to construct and administer surveys and how to use the data effectively, whether for summative or formative purposes (see, for example, Nardi, 2018; Rollett et al., 2021b).
First, we recommend that student survey instruments should include 10 or fewer Likert-type, opinion-based items that measure aspects of teaching that matter to the students’ experience. All too often, we’ve seen educators create surveys that are not just too long but that include a hodgepodge of items they’ve cut and pasted from other instruments. This may result in a survey that touches on a lot of key ingredients of good teaching, but since those ingredients aren’t arranged in a systematic way, it’s unlikely that they’ll generate valid information about how well a teacher measures up to established definitions of quality teaching. In short, it’s important to ensure that the items complement each other, so that they actually produce a coherent story about a teacher’s performance.
Another important first step when developing a student survey is to examine the literature on what it means to actually be an effective teacher, as well as any conceptual or theoretical frameworks that address important aspects of effective teaching practice and pedagogy. For example, the National Board for Professional Teaching Standards Core Propositions can serve as a framework for constructing a survey. But surveys could also delve into specific areas of interest, such as what it means to be a culturally responsive teacher (Ladson-Billings, 1995, 2014). The point is that survey questions shouldn’t be based on whatever the survey designer happens to view as important teaching practices — rather, they should be grounded in a solid body of research into a particular area of teaching practice. And the more survey items are tethered to established education theory about teaching quality, the more valid the survey will be (i.e., the more you can trust that it actually tells you something useful about the topic at hand). Further, a focused survey, grounded in a clear theory of teaching, will have fewer extraneous items, which helps to minimize errors that unduly skew ratings for or against the person being rated (Amrein-Beardsley & Haladyna, 2012). See Figure 1 for a theory- and research-based, as well as empirically validated, student evaluation instrument.
Typically, as illustrated in Figure 1, student surveys are designed to measure aspects of teaching effectiveness that apply to teachers across the board, whatever the subject area or grade level. But at times, it’s appropriate to add questions that relate to more specific teaching contexts (e.g., physical education, music, or art). When such items are added to a survey, however, the challenge is to make sure that they’re also grounded in research on effective instruction — otherwise, a couple of add-in questions could skew the results of the whole survey.
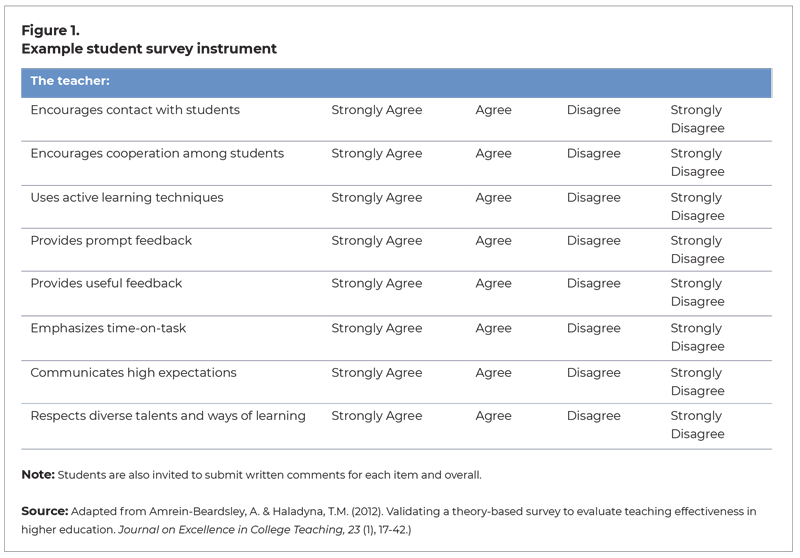
In addition to including Likert-scale items, surveys can also offer students opportunities to provide written feedback, and these data often provide the most valuable information. But if you do include such open-ended writing prompts, you should make sure to use clear, straightforward, simple-to-understand language that does not include any jargon and that is appropriate to students’ grade levels. There is no need to get fancy here. Keep it simple.
In terms of survey administration, the survey instruments themselves should remain the same over time, or “held constant,” so that trends over time can be observed and to help ensure that the survey is reliable. While items can be added if needed to address specific teaching contexts (e.g., online learning during or post-COVID) or unique facets of teachers’ classrooms (e.g., team teaching), the core items used (and validated) should remain the same. In addition, response rates of at least 70% are important to ensure the survey’s validity. To improve response rates, teachers can give students time in class to complete surveys (whether on paper or online), or they can email students reminders to complete and turn in the surveys if they’re completing them outside class time. However, they should avoid giving students assignment points, or drinks, foods, treats, or other incentives for completing surveys. Any incentives offered for filling out surveys can cause bias among respondents, reducing the validity of their responses.
When student surveys are used for formative purposes, the feedback they offer can be a powerful driver of change.
Also, survey responses should be entirely anonymous, so that students will feel they can be honest, without fearing a penalty from a teacher. Student names should not be collected on surveys. If the survey tool automatically collects identifying information (e.g., students’ email or IP addresses), administrators or central office staff should remove that information before sharing survey results with teachers. It is best to administer surveys electronically to eliminate the chances of identifying students by their handwritten responses to open-ended questions. And students should be discouraged from identifying themselves in their responses (e.g., by referencing specific incidents).
Finally, if student surveys are meant to provide useful feedback that actually helps bring about change in teaching practices, then it is important to involve teachers in all phases of survey development and to seek their input into the policies and procedures that surround the use of student surveys to evaluate teachers in summative and/or formative ways. If teachers are on board with the process, they will be better able to provide unified messages as to the importance and value of such evaluations, so that students understand the value of the feedback they can provide their teachers. When students and teachers alike see the value of surveys, they will be more likely to come to the table and enjoy the nourishment that a good feedback breakfast provides. Bon appétit!
References
Amrein-Beardsley, A. & Haladyna, T.M. (2012). Validating a theory-based survey to evaluate teaching effectiveness in higher education. Journal on Excellence in College Teaching, 23 (1), 17-42.
Blanchard, K. (2009, August 17). Feedback is the breakfast of champions. KenBlanchard [blog].
Blanchard, K. & Johnson, S. (1982). The one minute manager. William Morrow & Co, Inc.
Ferguson, R.F. & Danielson, C. (2014). How framework for teaching and Tripod 7Cs evidence distinguish key components of effective teaching. In T.J. Kane, K.A. Kerr, & R.C. Pianta (Eds.), Designing teacher evaluation systems: New guidance from the Measures of Effective Teaching project (pp. 98-143). Jossey-Bass.
Geiger, T.J. & Amrein-Beardsley, A. (2020). Student perception surveys for K-12 teacher evaluation in the United States: A survey of surveys. Cogent Education.
Kane, T.J. & Staiger, D.O. (2012). Gathering feedback for teaching: Combining high-quality observations with student surveys and achievement gains. Bill & Melinda Gates Foundation.
Ladson-Billings, G. (1995). Toward a theory of culturally relevant pedagogy. American Educational Research Journal, 32 (3), 465-491.
Ladson-Billings, G. (2014). Culturally relevant pedagogy 2.0: A.k.a. the remix. Harvard Educational Review, 84 (1), 74-84.
Nardi, P.M. (2018). Doing survey research: A guide to quantitative methods. Routledge.
Rollett, W., Bijlsma, H., & Röhl, S. (2021a). Current state of research and future perspectives. In W. Rollett, H. Bijlsma, & S. Röhl (Eds.), Student feedback on teaching in schools: Using student perceptions for the development of teaching and teachers (pp. 259-271). Springer.
Rollett, W., Bijlsma, H., & Röhl, S. (Eds.). (2021b). Student feedback on teaching in schools: Using student perceptions for the development of teaching and teachers. Springer.
Sawchuk, S. (2015). Teacher evaluation heads to the courts. Education Week.
Steinberg, M.P. & Garrett, R. (2016). Classroom composition and measured teacher performance: What do teacher observation scores really measure? Educational Evaluation and Policy Analysis, 38 (2), 293-317.
Walsh, K. & Ross, E. (2019). State of the states 2019: Teacher and principal evaluation policy. National Council on Teacher Quality.
Weisberg, D., Sexton, S., Mullhearn, J., & Keeling, D. (2009). The widget effect: Our national failure to acknowledge and act on differences in teacher effectiveness. The New Teacher Project.
Whitehurst, G.J., Chingos, M.M., & Lindquist, K.M. (2014). Evaluating teachers with classroom observations: Lessons learned in four districts. Brookings Institution.
This article appears in the May 2022 issue of Kappan, Vol. 103, No. 8, pp. 49-53.

ABOUT THE AUTHORS

Audrey Amrein-Beardsley
Audrey Amrein-Beardsley is a professor in the Educational Policy and Evaluation Program at Mary Lou Fulton Teachers College, Arizona State University. She is the author of Rethinking Value-Added Models in Education: Critical Perspectives on Tests and Assessment-Based Accountability and coeditor of Student Growth Measures in Policy and Practice: Intended and Unintended Consequences of High-Stakes Teacher Evaluations.
Tray Geiger
Tray Geiger is a senior analyst in the Office of the University Provost at Arizona State University, Tempe.


