


Journalists are pushing hard to get log-on data from district remote learning programs. Here’s why it’s so hard to get — and what to do when you find it.
By Bekah McNeel
Two weeks into remote learning, student participation was abysmal for Los Angeles high school students, education journalists Howard Blume and Sonali Kohli reported in their March 30 Los Angeles Times story.
Roughly 15,000 students were unaccounted for, and 40,000 – who account for a third of the city’s high school students – failed to check in daily, according to the article, which explained how the data reflected the city’s digital divide, student disengagement, and what teachers and district officials were doing in response.
But the news about student participation wasn’t highlighted by the district. “They released the information about the [student] log-ons in a public communication in which it was buried pretty deep,” Blume told The Grade in an email.
And the reporters struggled to get answers to some of their questions, according to Blume. As a result, the article had no figures for middle or elementary students.
While more such stories appear daily, relatively few education teams have been able to provide full data about remote learning’s reach in their areas.
Some reporters may not have asked. Others may not have gotten much of an answer. The Grade asked several large school systems for their log-on data to give a sense of participation rates, and only Atlanta Public Schools provided any.
Log-on data provide a peek into a student’s present realities at home and give information about learning gaps districts will see on the other side of COVID-19. Reporters can and should play a key role in making sure that districts are in fact tracking the data and responding to gaps.
“You can’t solve a problem if you’re not tracking it,” said Travis Pillow, editorial director for the Center on Reinventing Public Education, in a phone interview with The Grade. The bald numbers will tell us whether virtual learning is reaching enough students to be considered effective, Pillow said. Disaggregating and following up on data will also teach us more about the digital divide, student engagement, and students’ home lives.
To learn more about how the media covers education, follow The Grade on Twitter and Facebook.
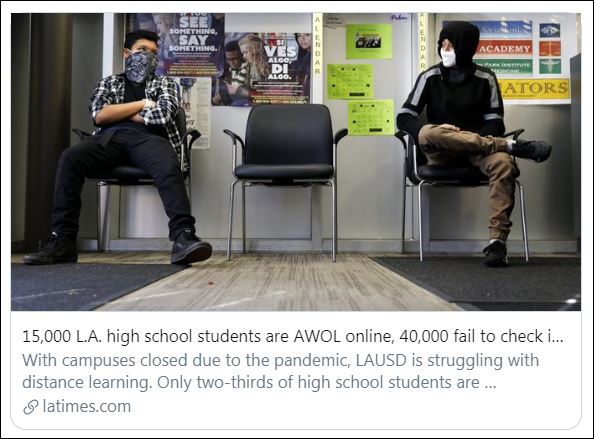
Above: This LA Times story from last week was among the first to report student participation rates.
What we do know
The Center on Reinventing Public Education has been tracking 82 districts and 18 charter networks across the country, and is seeing a trend in how districts are rolling out online learning and student data.
Phase 1 for school systems is establishing contact, Pillow explained, which includes distributing hot spots and laptops, and conducting needs assessments by phone. Phase 2 appears to be basic instruction plans, and “we’re starting to see that emerge,” Pillow said.
Phase 3 is tracking and reporting student participation data.
Why is it so hard to get any kind of participation data? I asked for some kind of metric from district and government sources in Atlanta, San Antonio, Miami, Seattle, New York City, and Minneapolis if they could help me get the information. Only one district (Atlanta) had such numbers on hand.
Some school district officials say they’re worried about doing such reporting without first addressing equity issues. They don’t want to be out of compliance with the federal Individuals with Disabilities Education Act or have students unfairly rapped because they are living in poverty.
Pillow’s organization reports that only a handful of districts have reached a point where they seem to be comfortable taking attendance and issuing grades.
The Miami-Dade County school system was among the fastest to roll out plans after mid-March closures and only planned to start taking attendance April 6.
Florida, in general, does seem to be the exception to the data void. Other Florida districts have made data available to reporters, allowing Tony Mixon at the Panama City News Herald to follow student log-on trends over the past week. A Brevard Public Schools official even published district log-on data on Space Coast Daily along with essential distance learning tech information for parents.
A handful of other media reports include remote learning participation data, including here, here, and here.
Sign up here for our free newsletter featuring the week’s best education news & newsroom comings and goings.
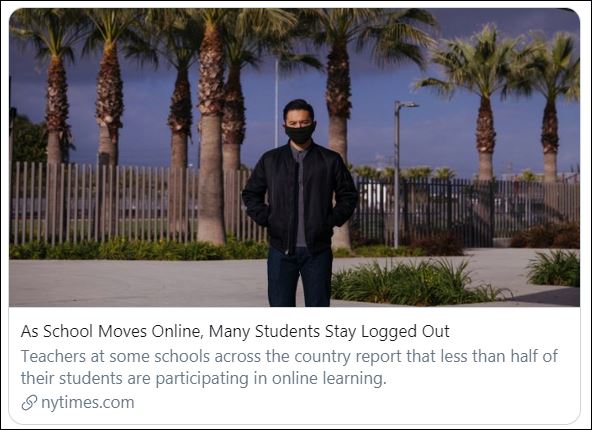
Above: This recent New York Times is one of a handful of stories that have attempted to include student long-on data.
Step 1: Getting the data for the first time
How can education reporters request the data? I have some tips based on my own experiences contacting several large school systems over the past few days.
Ask specific questions like these:
- Are you keeping track of log-ons to the district’s distance learning platforms? If so, are they disaggregated in any way?
- Are there other ways that the district is measuring student attendance, engagement, and participation?
Out of the major school districts that I pursued, the Atlanta Public Schools was the only one that had data to share.
This information was provided during a Zoom media roundtable with Superintendent Meria Joel Carstarphen.
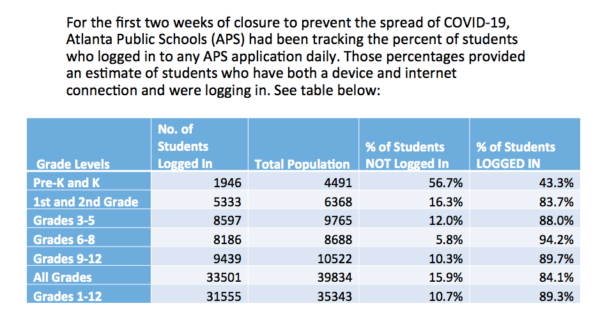
Above: According to Atlanta Public Schools, just over 10 percent of high school students had not logged in during a two-week period.
Step 2: Sorting out what the data means
Once you’ve got some data, be careful that you know what you’re looking at and present the information clearly to your readers.
For example, make sure the numbers represent unique log-ons by students. Atlanta school officials scrubbed its data to eliminate multiple log-ons by the same student, for example.
Also: Be clear about the time period covered by the data. The Atlanta data reflect a two-week interval.
Districts that serve high poverty populations will likely understand that daily log-ons are not always possible. The same goes for elementary and preK students, as seen in the Atlanta data. However, when deciding how to address learning losses, state and national officials will have to consider the frequency of instruction. Is once per week enough? Once per month?
Step 3: Digging deeper
Daily or weekly attendance data are just the surface of measuring a district’s remote learning program.
Reporters should also ask if the data reflect other engagement besides self-directed online work. Are school systems offering paper-based resources or one-on-one instruction via video because of the requirements of the Individuals with Disabilities Act (IDEA) or the needs of English language learners and other students?
Don’t forget, too, to ask about technical difficulties and the role they may play. As Atlanta has followed up with families, Carstarphen said they discovered that technical glitches were compromising the reporting. Because some schools were using platforms that allow users to log on to apps from within another app, some log-ons were getting lost.
Don’t presume that internet access is the main obstacle, the LA Times reporters found; pre-COVID-19 disengagement was another.
With all of the uncertainty around the new data, Blume said, the superintendent has been the only district official offering regular answers. It creates a bottleneck, Blume said, adding, “At the same time, people who work for the district are under tremendous pressure and it is important to consider this and treat them with some understanding.”
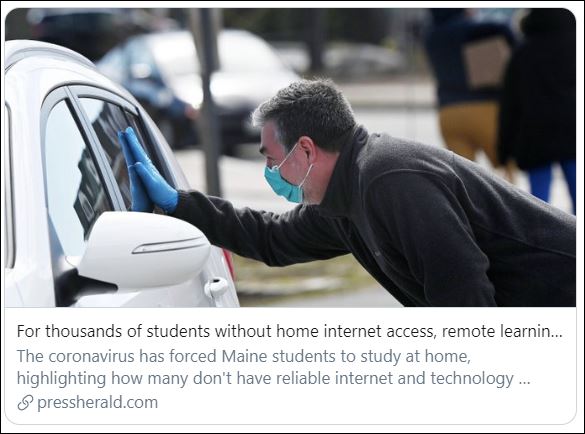
Above: This Portland Press-Herald story illustrates some of the ways journalists can work with the available participation data.
Working with what you can get
While log-ons won’t always be a story, the realities they uncover should be. “People in education think a lot about how chronic absenteeism is a huge equity issue,” Pillow said. That and other inequities, he explained, “are going to be amplified.”
The Portland Press Herald’s Rachel Ohm made this important connection in her April 5 story, For thousands of students without home internet access, remote learning is an extra challenge.
In her piece, Ohm references some state and district estimates of student log-ons, and provides a thorough breakdown of Maine’s long-standing problem with the digital divide. Specific log-on or engagement data from the district weren’t available, Ohm said in a phone interview with The Grade. She had to do what she could with existing statewide information on broadband access. “The data I was able to get was limited,” she said.
However, Ohm was able to put what data she could get into local and statewide context, examining varied efforts to address the divide — from university campuses to a statewide advocacy campaign. Ohm even spoke to one source who had previously opted out of home internet for personal reasons. Her story made it clear that COVID-19 had not created the remote learning problem, only highlighted it.
“It’s something I’m going to keep an eye on,” Ohm said.
Related coverage:
Why the LA Times’ COVID-19 coverage stands out
Newsroom flexibility is key to COVID-19 education coverage
Making the map: How EdWeek devised a must-have pandemic resource
How mainstream COVID-19 schools coverage surged — then fell
ABOUT THE AUTHOR

Bekah McNeel
McNeel is a freelance journalist who has been covering education for eight years. Her education reporting has appeared in The Hechinger Report, The 74 Million, The Christian Science Monitor, The Texas Tribune, Edutopia, and Texas Public Radio. Based in San Antonio, she also covers immigration, currently for Christianity Today. You can follow her on Twitter at @BekahMcneel.


