

Teacher misperceptions about students’ ability to learn may play a role in the underrepresentation of black students in advanced mathematics classes.
For two decades, at least, students’ scores on standardized reading and math assessments have been cited as evidence of persistent achievement gaps in K-12 education, and closing those gaps has been described as a critical goal for school reform. But many scholars and practitioners have become increasingly uncomfortable with the term achievement gap itself, which seems somewhat misleading and misrepresentative of the challenges facing students.
Researchers in mathematics education, for example, have found that students’ scores on the standardized tests they take in the spring have a lot to do with the math classes they were placed into at the beginning of the school year. As we have found in previous research (Faulkner, Crossland, & Stiff, 2013; Faulkner et al., 2014), teachers’ subjective perceptions of students’ abilities can affect crucial placement decisions that, in turn, affect student opportunities to learn and, down the line, their standardized test outcomes. In short, by making judgment calls about where students belong, teachers may inadvertently create much of the gap that school leaders then implore them to close (Garrity, 2004; O’Connor, Lewis, & Mueller, 2007; Stiff, Johnson, & Akos, 2011)
On the basis of such findings, we advocate that teachers adopt a “less-is-more” perspective regarding student placement for instruction — that is, less of a focus on teacher impressions of student achievement and more of a focus on academic performance data.
Let’s look at two examples of less-is-more decision making, one from medicine and the other from sports.
Predicting heart attacks
In his book Blink, Malcolm Gladwell (2005) gives us an example of less-is-more decision making in a Chicago hospital. Medical professionals in the emergency room were tasked with saving lives and money by better identifying which patients to admit into the hospital for suspected heart attacks. The decision-making system in place included doctors using their professional judgment to evaluate patients. Such evaluation entailed gathering a social history and performing physical examinations and diagnostic tests.
At the same time, the hospital’s lead administrator advocated the use of an algorithm for determining the seriousness of emergency room patient-care needs that involved using only four data points (an electrocardiogram, systolic blood pressure, fluid in the lungs, and unstable angina). As opposed to the more voluminous information collected through patients’ social histories, data gathered through the simpler four-point algorithm were highly predictive of imminent heart attacks. After two years of data collection, the four-point approach emerged a clear winner: It predicted heart attacks with 95% accuracy, compared with the 75%-89% accuracy of the status quo system. Also, using the algorithm resulted in a 70% increase in appropriately discharging patients who did not need to be hospitalized. Prompted by these findings, the hospital began to use the simplified four-point formula exclusively.
Predicting athletic talent
Another example of less-is-more thinking, taken from sports, may demonstrate more clearly the limitations of judgment in high-stakes decision making. It involves identifying sports talent at an early age and then placing youngsters in differentially competitive environments on the basis of a coach’s professional judgment of their perceived ability levels.
It begins with a seemingly innocuous finding: Ice hockey players in the National Hockey League are disproportionately born in January, February, and March. Why would that be? Convincing evidence reveals that coaches of young players don’t identify the best players — instead, they identify the most physically mature players within an age group (Barnsley & Thompson, 1988; Deaner, Lowen, & Cobley, 2013; Gladwell, 2008).
Analyses of the outcomes of this “talent identification” process have revealed that junior elite ice hockey players disproportionately are born in months that fall just after the cutoff date (January 1) for youth hockey leagues. The clear implication is that relatively older youngsters are being (disproportionately) identified as the most talented for their peer group. This error, which can be attributed in large part to the independent judgments of coaches, results in this select group of players participating in experiences that are crucial to their advancement as athletes. This includes more practice and skill development, accompanied by more opportunities to play on elite teams within their age cohort. Significantly, invaluable opportunities of this sort are typically not afforded to youngsters who have not been identified early based on perceptions of their athletic prowess.
Interestingly, a follow-up study (Deaner et al., 2013) found that these highly recruited players born in January, February, or March are actually less productive than their peers who were born in later months and who didn’t benefit from early selection. In other words, players born in later months who made it to the professional ranks have better professional statistics than their peers who were born in January through March and who benefited from positive selection bias. It seems that true talent is being squandered by so-called early-talent-identification practices.
These two examples demonstrate that well-intentioned independent professional judgments can contribute to highly problematic outcomes. All professionals must guard against decision-making behaviors that may aggravate existing inequities or introduce new ones. As far as teachers are concerned, their decision making directly influences student placements and opportunities to learn.
Teacher ratings and math placement decisions
To understand this dynamic better, we examined the decision-making process by which students are placed in advanced mathematics classes. In particular, we looked at 5th-grade teacher impressions of student performance (teacher ratings), students’ actual performance on math tests, and student background characteristics, such as their special education status and racial group (Faulkner, Crossland, & Stiff, 2013, Faulkner et al., 2014). We examined whether teachers’ implicit beliefs and expectations about students, as demonstrated in their evaluations of student performance, were consistent across different sets of students. We also aggregated high-achieving students to compare results.
Using a national data set — the Early Childhood Longitudinal Study: Kindergarten Cohort (U.S. Department of Education, 2002), which followed students from kindergarten through 8th grade — we compared students’ test performances with their teachers’ ratings of them to evaluate placement profiles. We expected the profiles to be consistent for all students across different demographic backgrounds.
All professionals must guard against decision-making behaviors that may aggravate existing inequities or introduce new ones.
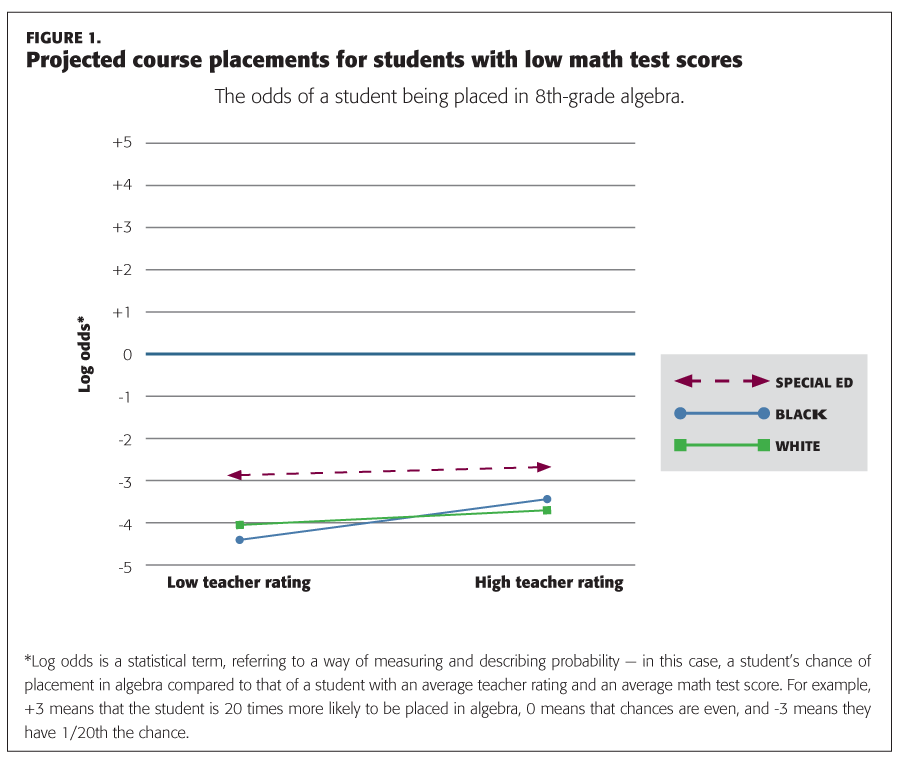
Indeed, our data indicated that students who perform poorly on mathematics tests have similar placement profiles. Figure 1 shows the odds of placement for low-performing students — the zero on the y-axis represents a 50/50 chance of being recommended for a given placement compared with average-performing peers. Anything below zero represents reduced odds of placement. In Figure 1, we see that among these low-performing students, those identified for special education, white students, and black students all have reduced odds of placement in Algebra by 8th grade, even if their teachers have rated them highly. Students identified for special education have a slightly higher rate of placement, but even here, the odds are greatly reduced compared with their average-performing peers. In other words, for students with demonstrated low performance on mathematics tests, the reality of their low performance determines their eventual placement for instruction.
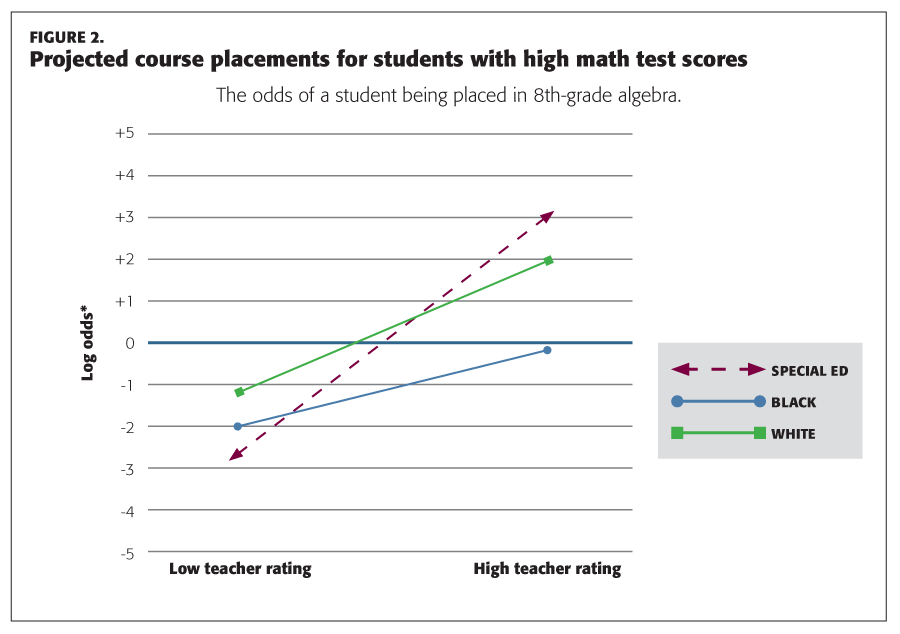
In contrast, for students who have performed well on mathematics tests, a less obvious pattern of placement emerges (see Figure 2).
Here we see that black students with a high math score are unlikely to be placed in algebra in 8th grade. This is true whether these students received a low or high teacher rating. By comparison, white students with a high math score and a high teacher rating had much greater odds of being placed in algebra. Special education students with a high math score and a high teacher rating had the greatest odds of such placement.
When perception trumps performance
The current discourse about the achievement gap tends to imply that one set of students, marked by immutable characteristics, simply is not performing as well as another set of students. For example, black students don’t perform as well as white students; therefore, there is a gap in achievement scores. This superficial reading of the data implies a diminished intellectual capacity among black students that is impervious to pedagogical intervention.
Contradicting that discourse, our findings indicate that the achievement gap is at least partially explained by a differential opportunity to learn that is not unlike the hockey example. Our data support the claim that there are high-performing black students who are being overlooked by education professionals because of presumptions made about their academic capabilities — presumptions that are not connected to the students’ actual performance in mathematics. Such findings indicate that, just as in the case of the hospital emergency room, it’s crucial in education to disentangle academic traits of individuals (students’ actual math performance) from general features of the broader category indicated by their presentation or social history to which those individuals belong (their racial group).
To make informed decisions about students’ academic needs and to make reliable projections about their future performance, educators must avoid the robotic categorization of students as at risk and obtain data that accurately reflect students’ past performance. To that end, when we recommend that less is more, we mean that if districts have policies that involve tracking or placing students into different groups for instruction, then performance data should be the primary factor in identifying students for such placements. Conversely, in light of the high degree of error found in placement decisions, we recommend that all students have access to high-quality, rigorous mathematics instruction and that students be separated into different placements as little and as late as possible.
It may seem to some that using performance data to place students won’t fix the problem. However, we believe that removing teacher judgment from the formula and using universally available academic achievement performance data will increase the true identification of high-performing students, thereby increasing the opportunity to learn among students of different demographic backgrounds. Increased opportunities for students will result in a reduction of achievement gaps.
There are high-performing black students who are being overlooked by education professionals because of presumptions made about their academic capabilities.
Recent research on the identification and placement of students into academically gifted programs provides data that illustrate and support the merit of our recommendation.
David Card and Laura Giuliano (2015) studied what they refer to as “one of the largest and most diverse” (p. 1) school districts in the United States, which, in 2005, was using the common practice of identifying students to be screened for gifted education on the basis of teacher recommendations and parent requests. Although blacks and Hispanics represented 60% of the overall student population, they represented only 28% of the students in gifted education programs. The following year, the district changed to a universal screening system to find and recommend students for testing who might otherwise be overlooked. Students who did well on this non-verbal ability screener were then provided the opportunity to test for placement in the gifted education program. After the system was implemented, the number of black students identified for gifted programs increased by 80% and the number of Hispanic students increased by 130%. Card and Giuliano concluded that “a substantial share of the gap appears to be caused by the failure of the traditional parent/teacher referral system to identify high-ability disadvantaged students” (p. 23).
Beware of blind spots and bias
Frequently, in explaining why a high-performing student wasn’t recommended for the next high-level math course, a teacher will use the following logic:
Yes, this student scored 4 (the highest score) on the standardized end-of-grade achievement test, but I’m worried about setting him up for failure. I’m not sure he’s getting the support at home he needs to succeed in the highest-level class, so I’m uncomfortable recommending him for that class.
In offering such a rationale, the teacher is unwittingly mitigating the effect of the student’s high score because of his or her own perception about the student’s home circumstances. However, ask yourself the following question: If two students achieved the highest score and one gets support at home and the other doesn’t, which is actually the more impressive performance? In our experience, we’ve found that teachers chuckle at the unexpected realization that scoring 4 without support from home is actually a more impressive accomplishment than scoring 4 with support from home. If you had to choose only one, which student has really earned the right to the higher placement?
While teachers may care deeply about their students, the unfortunate reality is that at times they make decisions that undermine student achievement, perhaps due to involuntary and unrecognized bias. In Blindspot: Hidden Biases of Good People, Banaji and Greenwald (2013) grapple with this issue across many disciplines. They conclude that implicit biases often have the most deleterious effects on disenfranchised groups. For example, they cite the effect of blinded auditions for selecting professional musicians. Listening to performances without knowing the gender of the performer resulted in a substantial change in the gender makeup of orchestras to include a more representative sample of women.
Our recommendation to education professionals is straightforward and simple: Analyze and assess current instructional placement practices to determine the extent to which they depend on and are informed by teachers’ subjective perceptions. Then consider inhibiting the use of independent professional judgments of student ability levels. Instead, use universal academic data to place students into mathematics classes. More students will have a pathway to academic success, and it will become clear that in terms of good decision making, less is more. K
References
Banaji, M.R. & Greenwald, A.G. (2013). Blindspot: Hidden biases of good people. New York, NY: Delacorte Press.
Barnsley, R.H. & Thompson, A.H. (1988). Birthdate and success in minor hockey: The key to the NHL. Canadian Journal of Behavioural Science, 20 (2), 167-176.
Card, D. & Giuliano, L. (2015). Can universal screening increase the representation of low-income and minority students in gifted education? NBER Working Paper No. 21519. Cambridge, MA: National Bureau of Economic Research. www.nber.org/papers/w21519
Deaner, R.O., Lowen, A., & Cobley, S. (2013). Born at the wrong time: Selection bias in the NHL draft. PLoS One, 8 (2).
Faulkner, V.N., Crossland, C.L., & Stiff, L.V. (2013). Predicting 8th-grade algebra placement for students with Individualized Education Programs. Exceptional Children, 79 (3), 329-345
Faulkner, V.N., Stiff, L.V., Marshall, P.L., Crossland, C., & Nietfeld, J. (2014). The impact of race and teacher perceptions as predictors of algebra placement. Journal for Research in Mathematics Education, 45 (3), 288-311.
Garrity, D. (2004). Detracking with vigilance: By opening the high-level doors to all, Rockville Centre closes the gap in achievement and diplomas. School Administration, 61 (7), 24-27.
Gladwell, M. (2005). Blink: The power of thinking without thinking. Boston, MA: Little, Brown and Company.
Gladwell, M. (2008). Outliers: The story of success. Boston, MA: Little, Brown and Company.
O’Connor, C., Lewis, A., & Mueller, J. (2007). Researching “black” educational experiences and outcomes: Theoretical and methodological considerations. Educational Leadership, 36 (541), 541-552.
Stiff, L.V., Johnson, J.L., & Akos, P. (2011). Examining what we know for sure: Tracking in middle grades mathematics. In W.F. Tate, K.D. King, & C.R. Anderson (Eds.), Disrupting tradition: Research and practice pathways in mathematics education (pp. 63-75). Reston, VA: National Council of Teachers of Mathematics.
U.S. Department of Education. (2002). Early childhood longitudinal study, Kindergarten class 1998-99. Washington, DC: National Center for Education Statistics.
Originally published in April 2017 Phi Delta Kappan 98 (7), 55-60
© 2017 Phi Delta Kappa International. All rights reserved.
ABOUT THE AUTHORS

Cathy L. Crossland
CATHY L. CROSSLAND is a professor in the College of Education, North Carolina State University, Raleigh, N.C.
Lee V. Stiff
LEE V. STIFF is a professor in the College of Education, North Carolina State University, Raleigh, N.C.
Patricia L. Marshall
PATRICIA L. MARSHALL is a professor in the College of Education, North Carolina State University, Raleigh, N.C.
Valerie Faulkner
VALERIE FAULKNER is teaching assistant professor, in the College of Education, North Carolina State University, Raleigh, N.C.


