

A new framework for measuring school quality represents a fuller picture of what people care about in a school.
How do you measure the quality of a school?
Well, it depends on whom you ask.
Policy leaders tend to embrace standardized tests as the go-to indicator. Many states, of course, include other measures in their accountability systems — measures like graduation rates or ones that show the narrowing of achievement gaps. The new Every Student Succeeds Act (ESSA) has pushed states to incorporate one nonacademic measure as well. But the coin of the realm at the policy level remains test scores. As principals and superintendents know all too well, the right scores can earn schools praise; the wrong ones can land a school in state receivership.
Parents and community members, meanwhile, tend to focus on other indicators of school quality. Sure, they may use test scores in their quest to understand a school’s relative standing. But primarily, they rely on reputation, word-of-mouth, and what they perceive with their own eyes, looking at factors like facility conditions or student demographics.
Both approaches are highly problematic.
Test scores often reveal more about the home lives of students than they do about what is learned in school because student scores tend to correlate with parental education and family income (Davis-Kean, 2005; Reardon, 2011). And even when we interpret test scores through the lens of “growth” — a fairer measure of what students have learned in school — they tell us little about the other things we want schools to do. They tell us nothing about school culture, for instance, or about student character and well-being outcomes. When we use test scores to measure school quality, as when we rely on thermometers to evaluate health, we get some useful information. But we don’t get the full picture.
Reputation, word-of-mouth, and observable characteristics have different shortcomings. A school’s reputation — good or bad — may be unwarranted. Word-of-mouth may be generated by a handful of vocal, nonrepresentative parents or by opinionated community members who have never set foot inside the school. A facility may be dingy on the outside but teeming with energy and enthusiasm inside. And stereotypes and biases may privilege the perceptions of some schools — particularly affluent suburban schools — over others. Thus, although some of this information is useful, it remains far from complete.
When we use test scores to measure school quality, as when we rely on thermometers to evaluate health, we get some useful information. But we don’t get the full picture.
The public thirst for information about schools is left unquenched by current efforts. Districts and states aren’t measuring the full range of what people care about, at least not in a fair and accurate way. Worse, current approaches to measurement may misrepresent school quality in a way that hurts our most vulnerable young people. Because low-income and minority students generally score lower on standardized tests, their schools remain more likely targets of highly disruptive intervention. Further, those low scores often substantiate the fears of quality-conscious, well-resourced parents who have departed in greater numbers for districts with better reputations, exacerbating segregation by race and class (Owens, 2016). The result can be a vicious cycle in which negative perceptions are both the cause and consequence of low performance (Mallach, 2014; Orfield, Frankenberg, & Lee, 2003).
What if there were a better way?
What if we could measure school quality more fairly and comprehensively? What if we could assemble a picture that more accurately matched the reality perceived by those who truly know a school?
A new framework for school quality
In spring 2014, our team began work in a small, urban school district in Massachusetts to build a new framework for measuring school quality (Schneider, 2017). Rather than beginning with the data available and then seeking to align them with relevant values and goals, we did the opposite. We began with a simple question: What do stakeholders — educators, parents, and the public — care about?
We began by looking at polling data. Organizations like Phi Delta Kappa (PDK), Gallup, Pew Research, and Editorial Projects in Education have done extensive polling on attitudes and values, providing indicators of what Americans believe is important in public education.
But we needed to dig deeper than national polls. After all, local attitudes may differ from national averages. Consequently, we began interviewing city residents, conducting surveys, and running small focus groups with different sets of stakeholders, including all school principals, community leaders, teachers at each school, parents, and district administrators. By the end of that process, we had a draft framework that appeared to reflect community values. (See Figure 1 for the most recent iteration of the framework.)
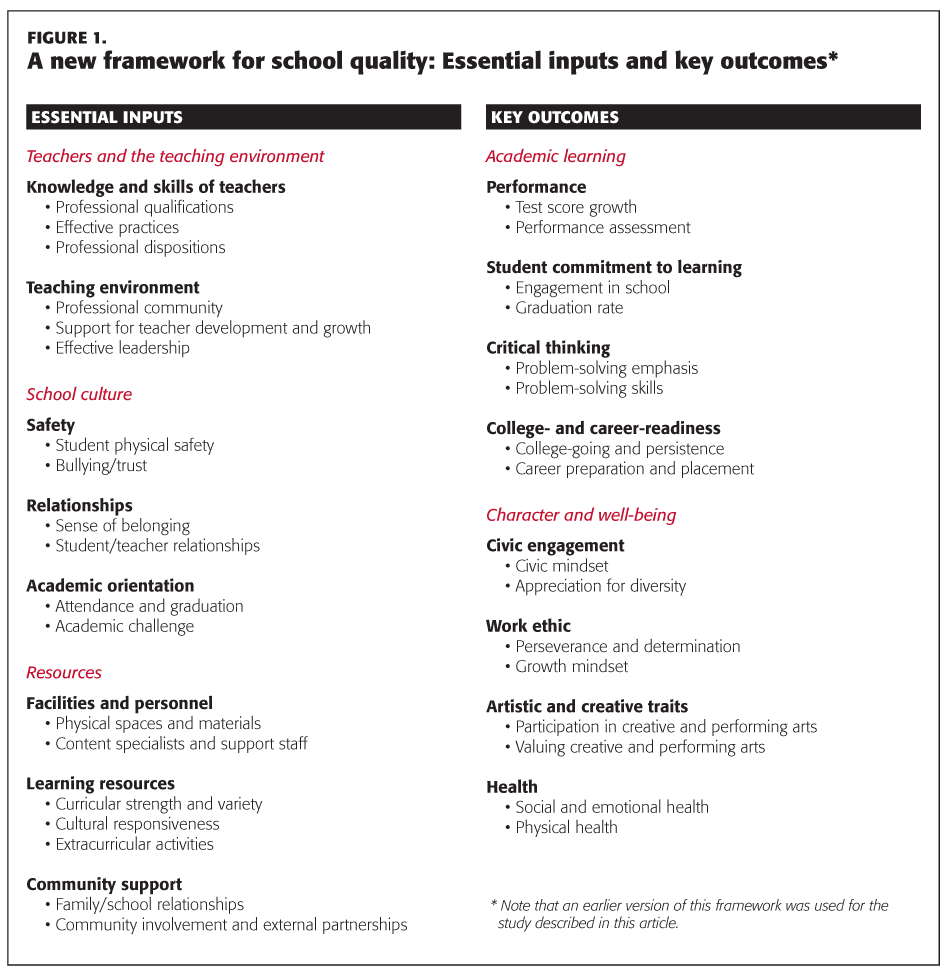
Although the framework doesn’t capture every aspect we might care about, we believe that these categories represent a much more coherent model of a good school. We view the first three categories as inputs. A school with a strong teaching environment, powerful school culture, and sufficient resources is quite likely to produce positive outcomes; a school lacking those elements will likely struggle. The other two categories in our framework, which focus on academic learning as well as on cultivation of student character and well-being, represent outcomes. Although a school with strong inputs typically produces positive outcomes, this doesn’t always occur. Thus, explicitly measuring outcomes provides important information.
Finding the right measures
In seeking measures aligned with our new framework for school quality, we reviewed available state-, district-, and school-level data. As noted earlier, in addition to recording scores from standardized tests in math and English, most states track data on a handful of other measures. For example, many publish average class size, attendance rates, and on-time graduation rates. Moreover, some states track factors like the number of students completing the core college-preparatory curriculum or the number planning to attend a postsecondary institution. For their part, most districts track teacher turnover, spending on professional development, and the range of courses available to students. All of these are helpful indicators of school quality.
Still, existing data often fell short. When that was the case, we identified ways to fill in the gaps. In some cases, we adapted measures created by others, such as by the University of Chicago’s Consortium on School Research, Panorama Education, the National Institutes of Health, and the Centers for Disease Control. In other cases, we constructed new survey scales aligned with our framework.
Although this may appear to be an overwhelming amount of data, collecting it was a fairly simple matter. The majority of the new data we gathered were the result of a student survey and a teacher survey, which were administered electronically to all teachers and all students in grades 4 and up. The rest of the data came from the state or the district. Once these data were collected, they were compiled anonymously by school and organized according to the school quality framework.
Presenting the data
Working with two web developers, our team built an online system that visualized the new data in a straightforward and user-friendly manner. On the home page of the web site, users could click on any of the district’s schools to view a school-specific page. And on each school’s page, they were presented with the five major categories of the framework, a description of each, and an overview of the school’s performance in the category.
Users interested in diving deeper could do so by clicking on any of the five categories. With data organized like a family tree, they could easily navigate down through subcategories, measures, and even specific questions. At every stage, users were supported by clear, simple descriptions and visual aids, as well as by color-coded interpretations of the data.
Also, we ran a series of focus groups, asking community leaders, parents, teachers, principals, and district administrators to help us define exactly what it means for a school to be performing at an “acceptable” level in each category. And for schools that fell below this threshold in one or more categories, we also estimated how long it might realistically take them (from less than two years to more than four) to raise their performance to an acceptable level. Finally, while we presented actual school data, we did not rank schools against each other — rather, we showed the progress that each school was making, on multiple levels, to reach and or surpass specific standards of quality.
Testing the system
Although the web tool has room for improvement, we believe it represents a major advance over what is currently available to the public. To test that premise, we conducted a modified deliberative poll of city residents (Schneider et al., forthcoming). We began by recruiting 50 demographically representative community members, an impressively diverse group. Then, on the day of the poll, we randomly divided participants into two different rooms. In one room, participants sat at computers that had been directed to the state education department’s web site. In the other room, participants sat at computers preloaded with our new interactive data tool.
In both rooms, participants answered questions about the city’s schools and their perceptions of the schools’ quality. They answered these questions for their “most familiar” school, which they were allowed to choose, as well as for a school that we randomly assigned to them.
Over three hours, we polled participants four separate times. In the first round, participants answered questions without having viewed any data. In the second, they looked at either the state data system or the new data system and then answered questions. In the third round, participants engaged in small-group conversations before answering questions. In the final round, we mixed participants from the two rooms together, encouraging them to talk with one another before responding to the fourth set of survey questions.
So, what did we learn from their responses?
Finding #1 — Usefulness of the data
Participants appeared to value the new data system more highly than they valued the state’s data system. This manifested quite clearly in participant self-reports about how much they had learned from each set of data as well as about how much they valued that information:
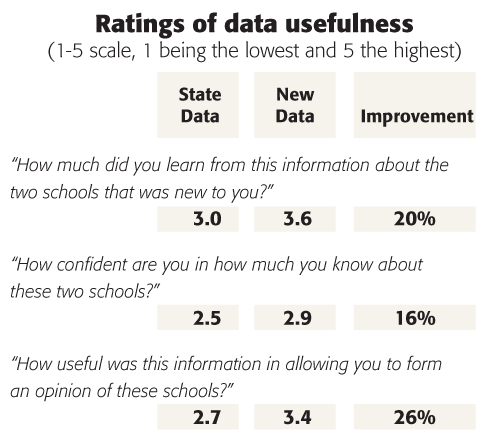
In addition to more highly valuing the new data, users also seemed objectively more knowledgeable when they had access to our web tool. Specifically, those using the broader set of data selected the “I don’t know” option on our survey far less frequently than their peers working with state data. Although members of each group started out with relatively similar percentages of “I don’t know” responses, “I don’t know” responses among users of the new data tool decreased 80% to 100% for all questions.
Finding #2 — A clearer view of school quality
Our second interesting finding concerned perceptions of school quality. When participants used the two different data systems to rate familiar schools — often the schools attended by their children — their scores did not differ much. Perhaps this is because raters already possessed rich, wholistic understandings of school quality that were not altered much by data. When it came to unfamiliar schools, however, the results were striking. When rating an unfamiliar school, those who viewed the broader set of data tended to assign higher scores (3.5 compared with 2.8):

As the chart above indicates, participants using the new data system gave nearly identical scores to randomly assigned schools and familiar schools. Those using the state data system, by contrast, had much more negative perceptions of their randomly assigned schools. Without wholistic knowledge of the schools in question, whether from personal experience or from accessing broader set of data, these participants issued substantially lower ratings.
Finding #3 — The spillover effect
The third finding that leapt out at us was the fact that the new data system appeared to change the views of even those who had not interacted with it.
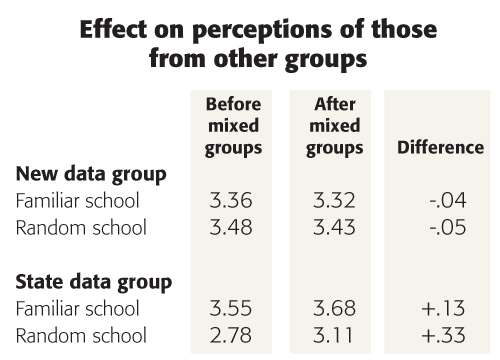
After viewing data on their own, participants were placed in mixed groups of both new data viewers and state data viewers. The purpose of mixing groups was to see if engagement with data might spill over to affect those who had not actually looked at the new system — an analogue for neighbors talking with each other across the fence. For instance, would talking with someone from the new data group change the opinions of a participant from the state data group, even if he or she had not interacted with the new data?
As the chart below indicates, these conversations did not substantially affect participants working with the new data. Notably, however, those working with the state data system ended up with more positive opinions of the schools after talking with those who had used the new data system. This was particularly the case if the schools in question were unfamiliar ones. In other words, the perceptions of viewers of the state data moved a fair bit closer to the perceptions of the new data group. Those in the new data group, by contrast, shifted their views toward the state data group only slightly:
Looking to the future
Our work, though promising, represents only a preliminary step forward in the daunting task of evaluating schools. Our framework will need additional refinement, our measures need to be further refined and tested, we need to continue testing user responses, and we need to more fully develop our web tool.
Yet we believe that our work indicates something hopeful — that school quality can be measured in a fair and accurate way and that parents and citizens will find this information both useful and informative.
Under ESSA, states and districts retain greater discretion over the measures included in their state and district report cards. Moreover, ESSA now requires states to include data on school quality, climate, and safety. This shift provides an opportunity for states and districts to think intentionally about the multiple aims of public education and about the many ways that schools can be measured. As they do, they will have an additional opportunity to consider how best to inform parents, teachers, policymakers, and the public.
Better data systems do not represent a silver bullet. But we do believe that better data systems might align perception and reality when it comes to the question of school quality — a matter of no small importance.
Each year, the PDK Poll of the Public’s Attitudes Toward the Public Schools finds that Americans have much more negative perceptions of the nation’s schools than they do of the schools their own children attend. One possible explanation for this is that stakeholders may be influenced by what might be termed a “home team bias,” ignoring data in order to cling to positive impressions. Yet research has shown that the public maintains generally accurate perceptions of their children’s schools (West, 2014).
An alternative explanation is that the higher ratings given to familiar schools reflect a fuller account of performance. In other words, familiar raters may be taking other information into account, along with test scores, thereby arriving at more balanced assessments. If this is true, better data systems might begin to counter the perception that most schools are performing poorly — a perception that drives policy and shapes many people’s decisions about where to live. Although public schools are hardly perfect, the narrative of crisis, fostered by the reliance on standardized test scores as measures of school quality, has exacerbated segregation and fostered a policy context conducive to disruptive reform. This is a problem that our data systems helped create — and it’s one they can help solve.
References
Davis-Kean, P.E. (2005). The influence of parent education and family income on child achievement: The indirect role of parental expectations and the home environment. Journal of Family Psychology, 19 (2), 294-304.
Mallach, A. (2014). The uncoupling of the economic city: Increasing spatial and economic polarization in American older industrial cities. Urban Affairs Review, 51 (4), 443-473.
Orfield, G., Frankenberg, E.D., & Lee, C. (2003). The resurgence of school segregation. Educational Leadership, 60 (4),16-20.
Owens, A. (2016). Inequality in children’s contexts: Income segregation of households with and without children. American Sociological Review, 81 (3), 549-574.
Reardon, S.F. (2011). The widening academic achievement gap between the rich and the poor: New evidence and possible explanations. In G.J. Duncan & R.J. Murnane (Eds.), Whither opportunity? New York, NY: Russell Sage Foundation.
Schneider, J. (2017). Beyond test scores: A new way of measuring school quality. Cambridge, MA: Harvard University Press.
Schneider, J., Jacobsen, R., White, R., & Gehlbach, H. 2017, March 2). The (mis)measure of schools: How data affect stakeholder knowledge and perceptions of quality. Teachers College Record, 120 (6). http://bit.ly/KappanSchneider
West, M. (2014). Why do Americans rate their local public schools so favorably? The Brown Center Chalkboard. Washington, DC: Brookings Institution.
Originally published in April 2017 Phi Delta Kappan 98 (7), 43-48. © 2017 Phi Delta Kappa International. All rights reserved.
ABOUT THE AUTHORS

Hunter Gehlbach
HUNTER GEHLBACH is an associate professor at the Gevirtz Graduate School of Education, University of California, Santa Barbara, and director of research at Panorama Education.

Jack Schneider
Jack Schneider is the Dwight W. Allen Distinguished Professor at the University of Massachusetts Amherst and director of the UMass Center for Education Policy.
Rebecca Jacobsen
REBECCA JACOBSEN is an associate professor in the Department of Educational Administration at Michigan State University, East Lansing, Mich.
Rachel S. White
Rachel S. White is an assistant professor of K-12 educational leadership at Old Dominion University, Norfolk, VA.


