

New research findings challenge common assumptions about summer learning loss.
In 1996, a team of scholars at the University of Missouri conducted a comprehensive meta-analysis of earlier research on the extent to which students learn and/or forget academic content and skills during the summer months (Cooper et al., 1996). They found that the test scores of students from low-income backgrounds tend to drop between the spring and the fall, while the scores of middle-class and wealthy students tend to remain the same (in math) or show some improvement (in reading). A decade later, another study — in which researchers from Johns Hopkins observed a group of Baltimore students from 1st grade, in 1982, to age 22 — found that differing summer experiences in the early elementary years explained most of the test-score gap between rich and poor kids in the 9th grade (Alexander, Entwisle, & Olson, 2007)
Since then, it has become common knowledge among educators and the general public alike that poor and working-class students tend to experience “summer learning loss” (sometimes referred to as “summer slide” or “summer setback”). Journalists frequently refer to these research findings, and policy makers often cite them when making decisions about summer programs and the length of the school year.
But in fact, the research into summer learning loss is far from conclusive.
For at least two important reasons, the evidence deserves another look. First, the 1996 study relied mainly on data collected in the 1970s and 1980s, and the findings may not generalize to today’s educational and social contexts. Second, the more recent national studies were only able to examine students’ summer experiences following kindergarten and 1st grade, without addressing subsequent summers. In truth, while these early findings have fueled a great deal of concern about summer learning loss, we actually know much less about this phenomenon than is often assumed.
Further, recent research (von Hippel & Hamrock, 2019) points out flaws in the testing and scaling procedures used in much of the earlier research, including the Baltimore study. In particular, many early studies administered more difficult versions of tests in the fall than in the previous spring, confounding estimates of summer learning loss with differences in the tests themselves. Luckily, advances in testing procedures have mostly eliminated this problem.
In the last 10 years, new insights on summer learning loss in early elementary school have become available thanks to nationally representative data collected by the Early Childhood Longitudinal Study (ECLS-K), which follows one set of students who started kindergarten in 1998-99 and another who started in 2010-11. Using both of the ECLS-K studies, Paul von Hippel, Joseph Workman, and Douglas Downey (2018) found near-zero levels of growth during the summers following kindergarten and 1st grade, which they note would be “better described by a phrase like ‘summer slowdown’ or ‘summer stagnation’” (pg. 337) rather than the more common “summer loss” terminology. Additionally, the researchers did not find much evidence to support prior findings that socioeconomic and racial/ethnic inequality widens during the summer.
In short, what we know about summer learning loss is more limited and contradictory than many realize, with varying findings about whether summer setback occurs at all and whether inequality widens during the summer, particularly for students in upper elementary and middle school.
A fresh look, using a new source of data
Given the limitations of our current understanding of summer learning loss, I decided to take a fresh and deeper look at the problem and test the prevailing assumptions about which students lose ground during the summer.
For this research, I analyzed data from more than 3.4 million students in all 50 states who took the NWEA MAP Growth reading and mathematics assessments between the 2016-17 and 2017-18 school years. MAP Growth is typically administered in both the fall and spring across kindergarten to 8th grade, allowing us to gauge student progress both during the school year and over the summer. MAP Growth’s cross-grade adaptive design eliminates the problem of changing tests in earlier studies and uses a single scale that allows for the estimation of change from one point in time to another.
The first question I set out to answer was whether students, on average, lose ground during the summer. For grades K-8, I obtained students’ spring and fall scores and assessment dates from 2017. Schools using MAP Growth assessments set their own testing schedules, leading to considerable variation in the number of days that a student has been in school prior to testing. To properly account these time differences, I collected district calendars from participating school districts to check the amount of time each student had been in school after spring testing and before fall testing.
Summer learning loss is common and substantial, but not inevitable
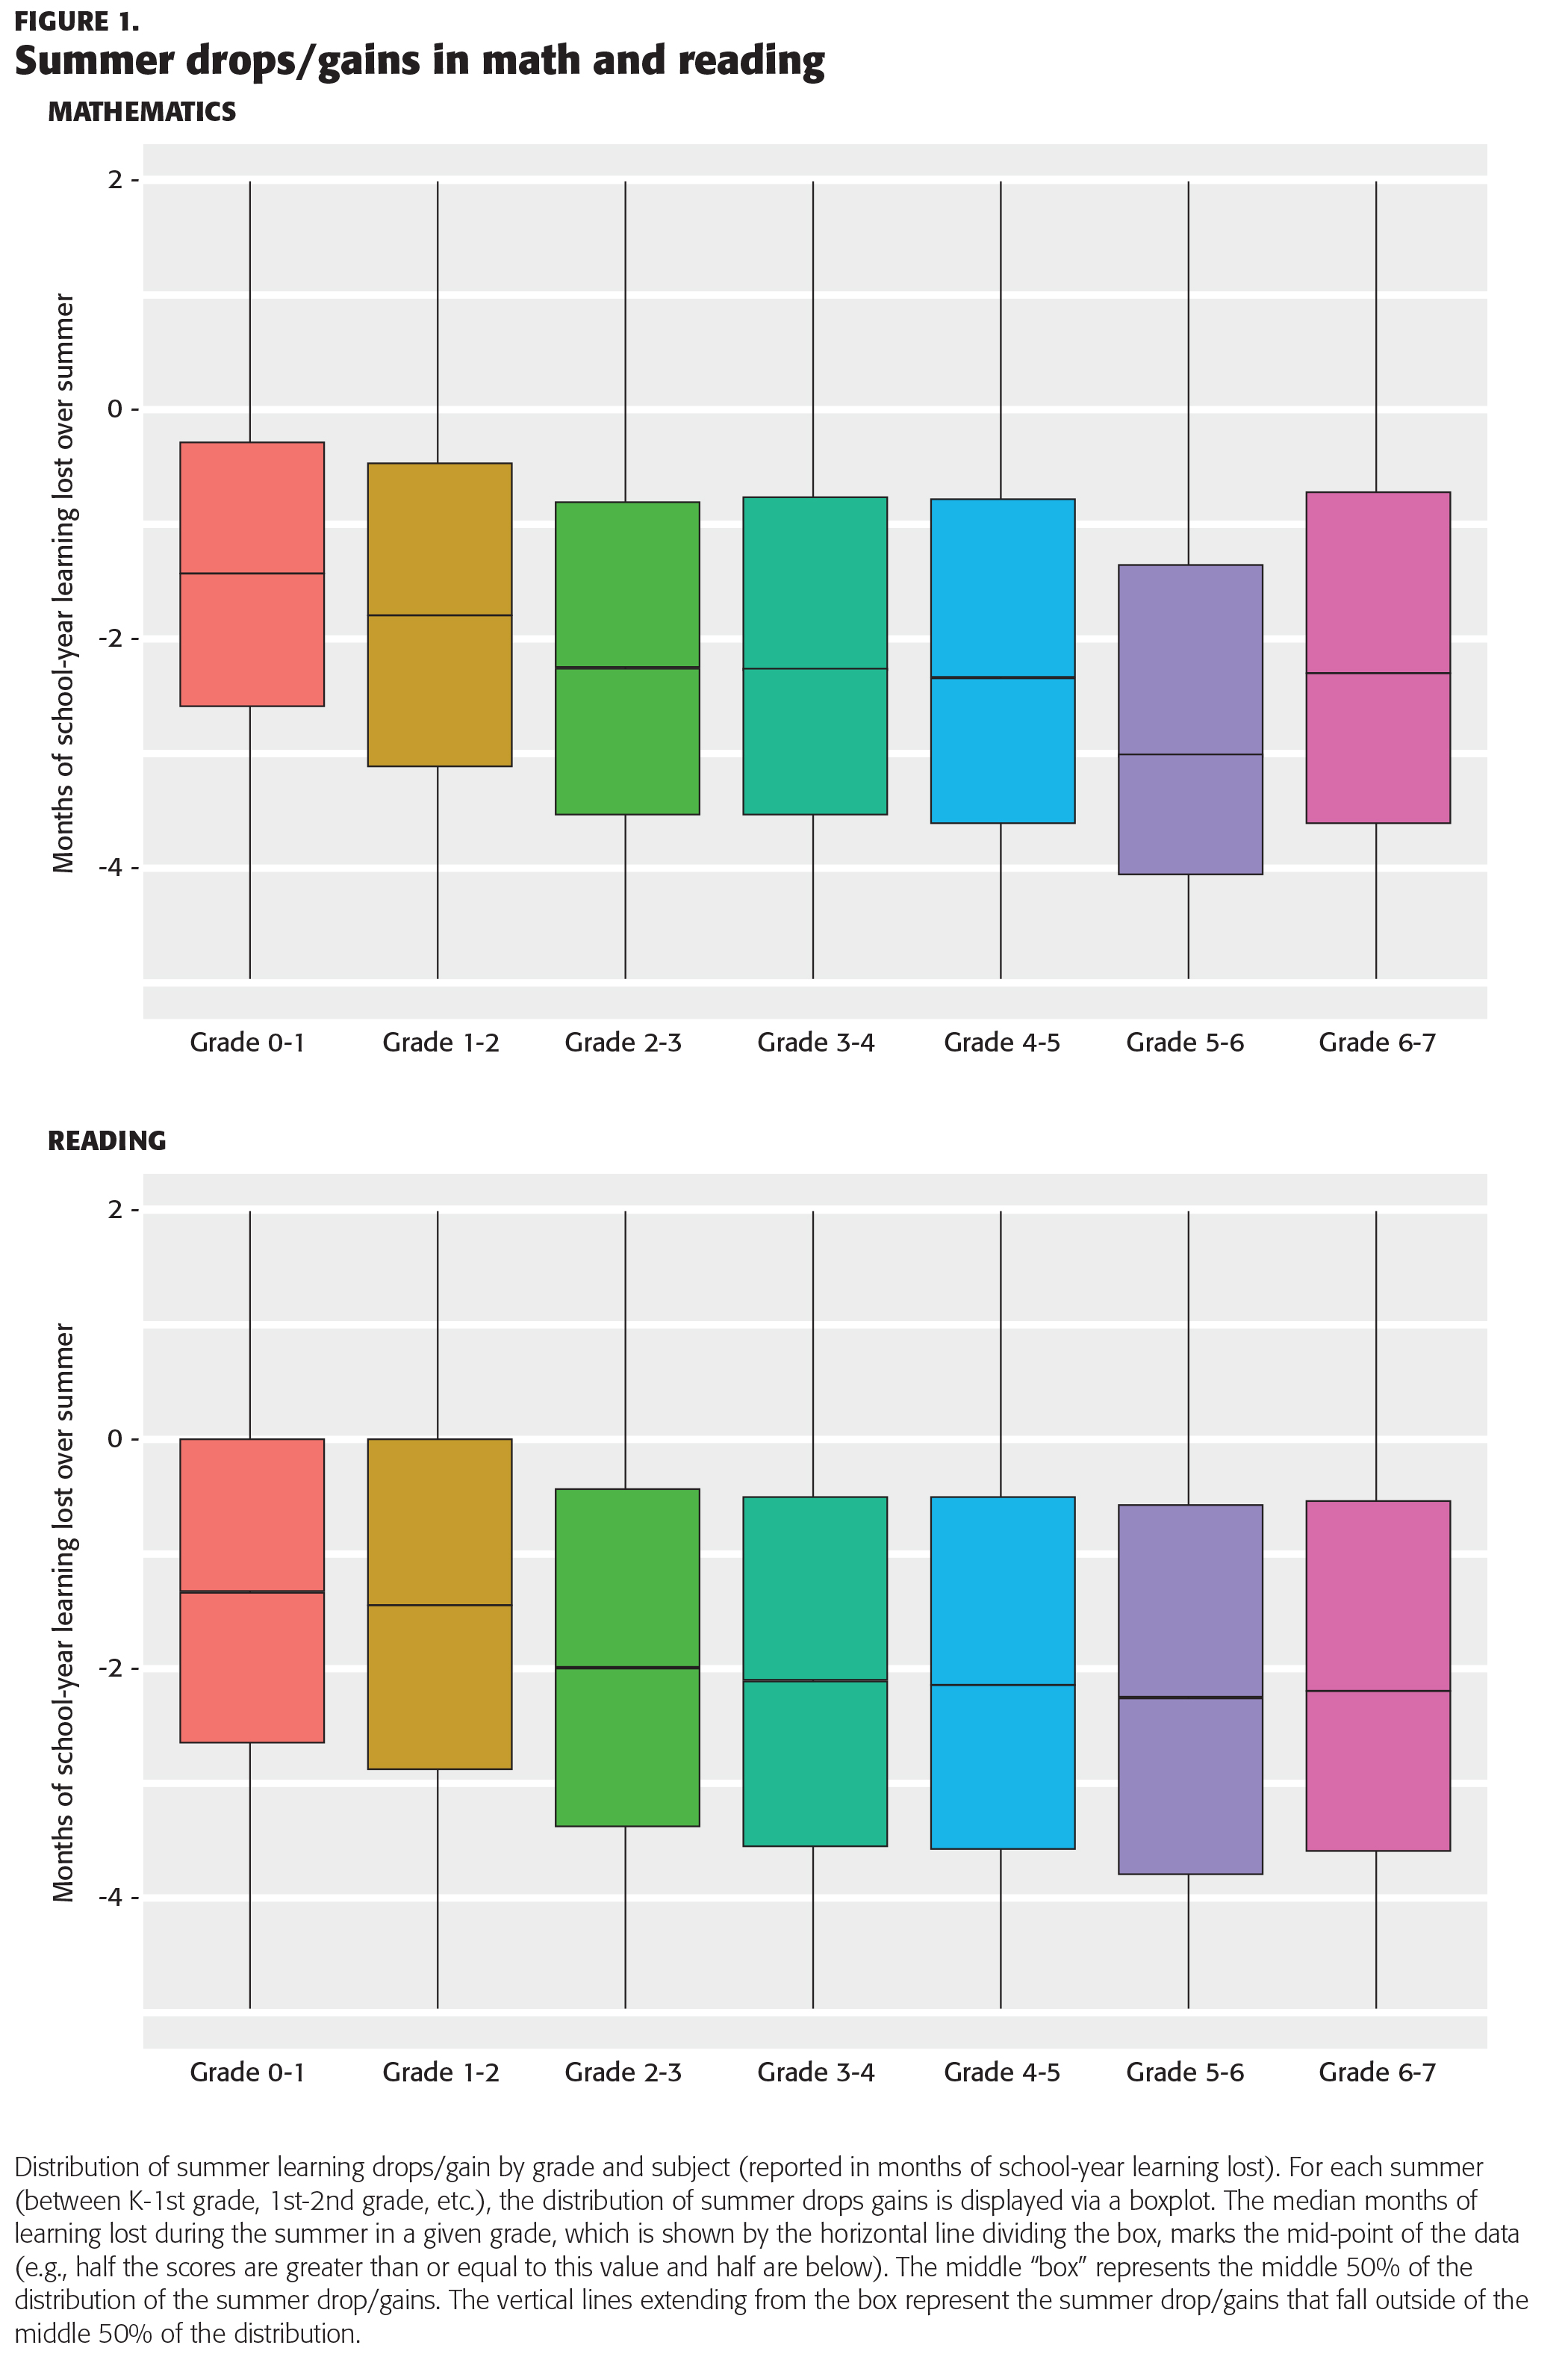
Figure 1 displays the distribution of summer learning loss by grade and subject, from the summer following kindergarten through 6th grade. Summer learning drops are reported in the scale of months of school-year learning. The typical (50th percentile) student showed summer learning loss across all studied grades in both reading and math. The median summer losses are fairly large in magnitude, ranging from losses of one to two months in reading and a little more than one to three months of school-year learning in math.
It is also clear, as Figure 1 shows, that there is a large amount of variation in summer learning patterns. Seventy percent to 78% of students lost ground in math during the summer within the elementary school grades, compared to 62% to 73% of students in reading. The summer between 5th and 6th grade, which corresponds to the transition between elementary and middle school for many students, represented the largest summer drop in math, with 84% of students demonstrating summer slide. It is important to remember, however, that these findings indicate that 22% to 38% of students show gains during the summer, implying that summer learning loss is not inevitable.
The more students gain during the school year, the more they lose
Given the wide range of summer learning patterns, I also examined whether some students are disproportionately more likely to see summer learning loss. I estimated students’ summer drops/gains from the spring to fall of 2017 and compared the degree to which students’ summer learning patterns were associated with (a) students’ race/ethnicity and gender, (b) students’ test scores in the fall of 2016 and their fall-spring score gain, and (c) a set of school and neighborhood characteristics that measured the degree of poverty and hardship in a student’s environment.
These analyses showed a somewhat surprising result: The strongest predictor of whether a student would experience summer gains or losses was the size of gain the student had made during the previous academic year. That is to say, the more students learned during the school year, the more likely they were to lose ground during summer break. Knowing how much a student gained in the prior year alone explained between 22 and 39% of the variation in summer learning patterns (depending on the grade/subject).
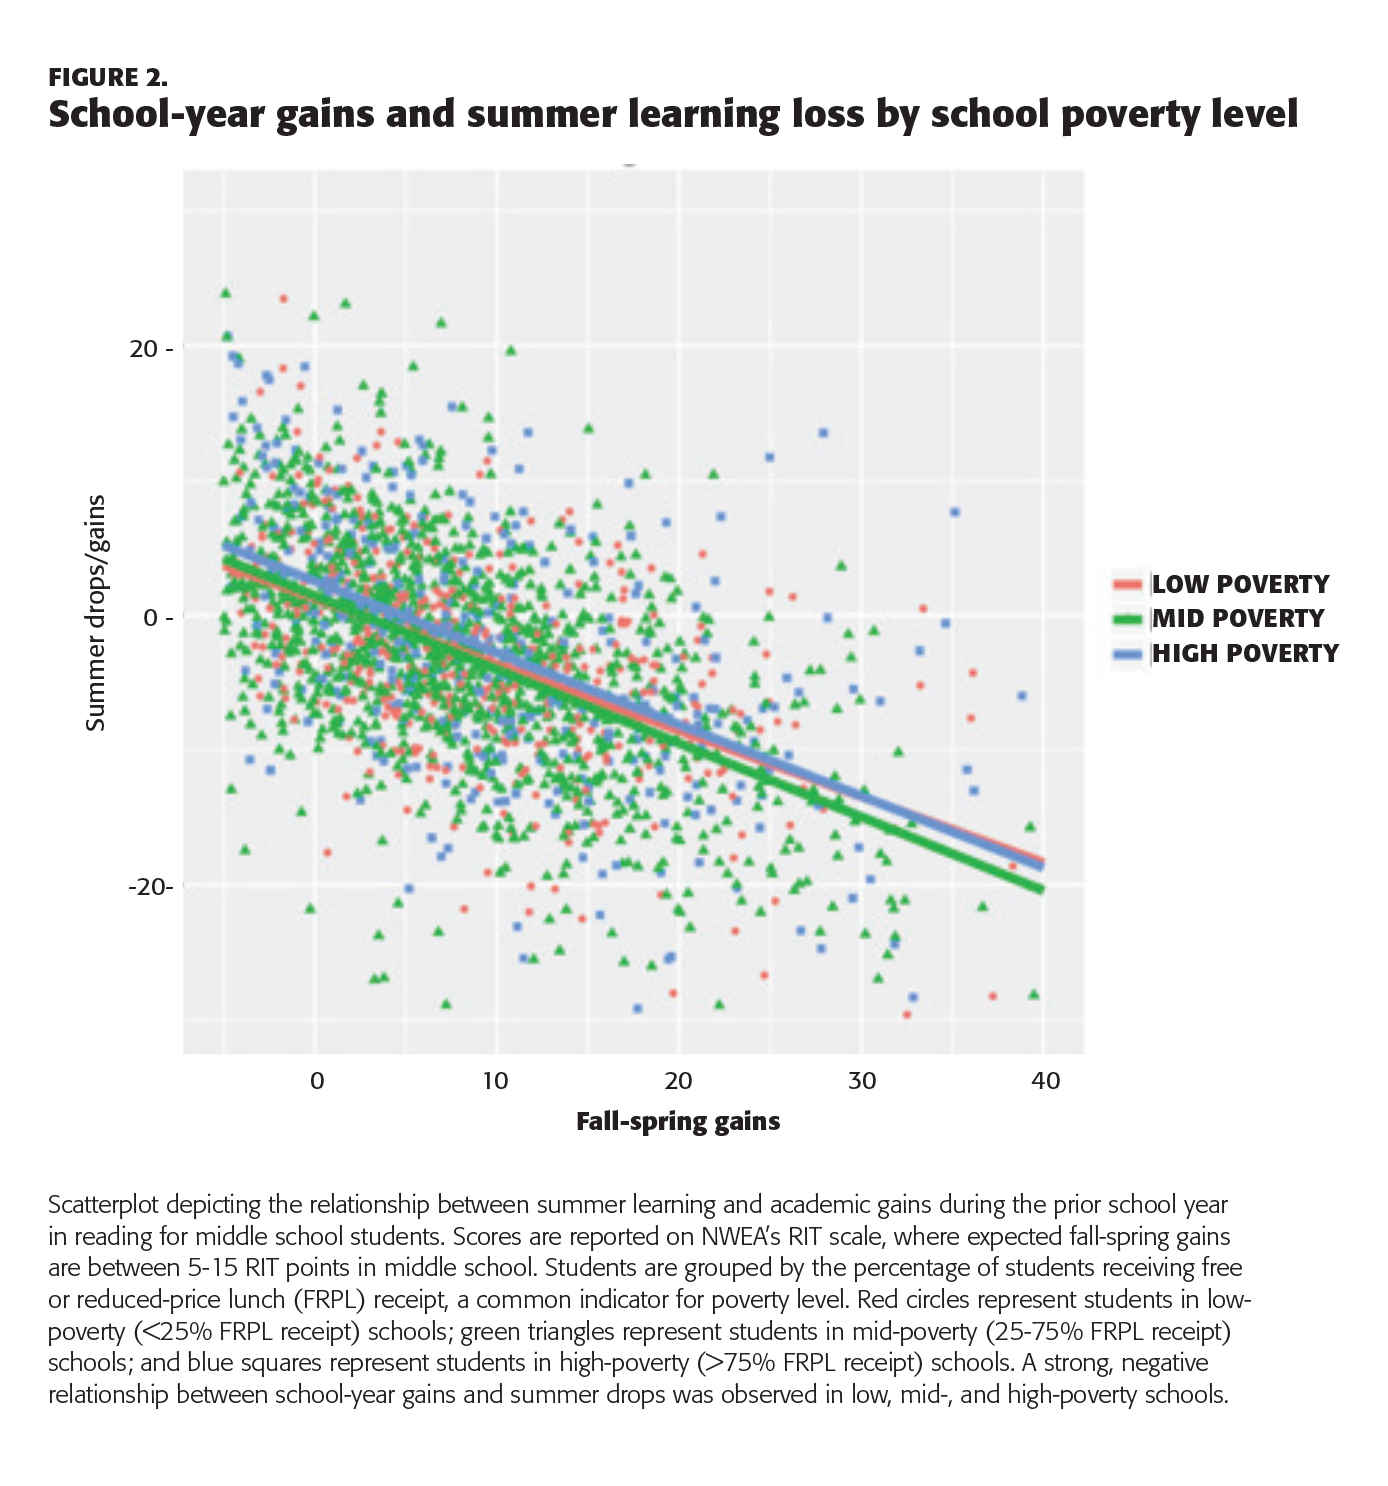
By contrast, student race/ethnicity explained only 1% of summer loss. Students in higher-poverty schools did show significantly more loss during the summer in later elementary and middle school, though differences were small (at most, one week of school-year learning). Figure 2 (see following page) displays the relationship between school-year gains and summer drops by school poverty level. The diagonal lines show the expected summer drop dependent on (a) a student’s school-year gain (position on the x-axis), and (b) whether a student is in a low-, mid-, or high-poverty school. These results indicate that the strong negative relationship between prior-year growth and summer learning loss holds whether students are in high- or low-poverty schools.
This finding, that prior gains during the school year were the strongest predictor of academic drops in the summer, has been rarely discussed as a potential explanation for summer loss patterns.
What about the other possible explanations?
These findings raise questions about some of the most common explanations for summer learning loss.
The faucet theory
One theory about summer learning loss posits that school is like a “faucet” that pours out resources during the academic year, enabling all students to make learning gains (Entwisle, Alexander, & Olson, 2000). When school closes for the summer, the faucet shuts off. Presumably, that means no more learning for students from disadvantaged backgrounds, while wealthier students have access to other learning opportunities. For example, one study, using the ECLS-K data, found that during the summer after kindergarten, childcare arrangements were more regular and visits to zoos and aquariums were more common for nonpoor children than poor students (Redford et al., 2018).
However, my own findings offer little to no support for this theory. Neither race/ethnicity nor gender explained much of the considerable variation in students’ summer learning patterns, and school and neighborhood poverty were, at most, modestly associated with summer learning loss. That is, my data suggest that we consider other possible explanations.
Access to summer programs
It is commonly believed that students who attend summer school or participate in informal summer reading programs are more likely to show gains during the summer than kids without access to these resources. For example, a recent study of children who attended voluntary summer learning programs in five urban school districts found that these programs resulted in modest short-term gains in mathematics (Augustine et al., 2016). However, those gains dissipated by the next fall, and no benefits were observed related to language arts, social-emotional outcomes, student attendance, or grades during the school year. Other studies have found summer reading programs to be effective, particularly for low-income students (see Kim & Quinn, 2013, for a review), but these programs tend to be costly and often struggle to recruit and retain students and high-quality teachers. (Home-based summer reading programs, which typically involve mailing books to students during the summer, have shown some promise as a more cost-effective intervention; Quinn & Polikoff, 2017.) In short, the research is not yet conclusive as to whether children’s participation in formal or informal summer programs helps explain their variation in summer learning patterns.
Length of the school year
Most school calendars in the United States have approximately 180 school days, with a summer vacation that lasts one to three months. It seems logical to assume that students whose vacations are longer would tend to show more summer learning loss. However, a review of the research available through 2009 indicated that extending the school year had at best a small positive impact on academic achievement over time (Patall, Cooper, & Batts Allen, 2010). Nor does achievement appear to improve at schools that adopt a year-round school calendar (which includes a number of short breaks rather than a long summer vacation), an approach that has become increasingly common over the last few decades. According to a recent review of the evidence on year-round schooling, students’ overall year-to-year learning gains are more or less same whether their schools use a year-round or traditional nine-month calendar (von Hippel, 2016).
Test disengagement
Finally (though this theory has been discussed less often in the context of summer learning loss), perhaps students tend to score low on their post-summer tests because they’re not trying very hard to do well on them, rather than due to any real loss of knowledge or skills.
In fact, when students were tested, and how much effort they made on the test, does appear to explain some of the large variation in results that we observed. Students typically are not assessed on MAP Growth until four to eight weeks into the school year. While researchers try to account for the within-school time in estimates of summer loss through simple assumptions about student learning rates, we probably fail to capture the variation in the degree to which teachers have “caught up” students in the first weeks of school. Further, in a related study, my colleagues and I found that students are more likely to disengage from testing in the fall than in the spring, particularly in the middle grades (Kuhfeld & Soland, in press).
It is possible, then, that students tend to be less motivated to do well on tests after summer vacation. Or their teachers may coach them to try harder when they take the test in the spring, when it matters for accountability purposes. That is, while their scores may suggest that students have lost ground over the summer months, this might reflect little more than the fact that they rushed and made random guesses on the fall test, or perhaps that their teachers have been slow to review last year’s material. Our initial data do not show test disengagement to be strongly associated with patterns of summer learning loss, but it is a plausible theory, deserving of more research.
Making the most of summer
Given the prominence of early studies of summer learning, educators and policy makers have tended to assume the data are clear on summer learning loss: Poor kids tend to lose ground, while affluent kids stay in place or move ahead. However, my results indicate that summer vacation does not have a disproportionately negative effect on the academic trajectories of minority students or students in high-poverty schools. Of the students I studied, between 62 and 78% (across the grade levels) lost academic ground during the summer. Attending a high-poverty school had very little effect.
Furthermore, many educators and policy makers have also made assumptions about the causes of and likely solutions for summer learning loss. For instance, it is assumed switching to a year-round schedule or providing poor kids with school-based interventions over the summer will solve the problem. But while those may be appealing explanations and potential solutions, the research support for them is not as strong as many suspect. According to my own recent studies, an underexamined explanation for summer loss is that spring-to-fall test-score declines tend to be most pronounced for students who had the largest gains from fall to spring. Knowing this, schools that track students’ fall-to-spring learning should be able to identify those students who made above-average gains in the current school year and may be at highest risk for losing ground during the summer.
Finally, since summer represents an important window of time in which students who are behind may be able to catch up to higher-performing students — if given appropriate and high-quality summer enrichment opportunities — researchers should make it a priority to learn more about how to provide the most effective summer activities for differing kinds of learners.
References
Alexander, K.L., Entwisle, D.R., & Olson, L.S. (2007). Lasting consequences of the summer learning gap. American Sociological Review, 72 (2), 167-180.
Augustine, C.H., McCombs, J.S., Pane, J.F., Schwartz, H.L., Schweig, J., McEachin, A., & Siler-Evans, K. (2016). Learning from summer: Effects of voluntary summer learning programs on low-income urban youth. Santa Monica, CA: RAND Corporation, www.rand.org/pubs/research_reports/RR1557.html
Entwisle D.R., Alexander K.L., & Olson L. S. (2000). Summer learning and home environment. In R. D. Kahlenberg (Ed.), A nation at risk: Preserving public education as an engine for social mobility (pp. 9–30). New York, NY: Century Foundation Press.
Cooper, H., Nye, B., Charlton, K., Lindsay, J., & Greathouse, S. (1996). The effects of summer vacation on achievement test scores: A narrative and meta-analytic review. Review of Educational Research, 66 (3), 227-268.
Kim J.S. & Quinn D.M. (2013). The effects of summer reading on low-income children’s literacy achievement from kindergarten to grade 8: A meta-analysis of classroom and home interventions. Review of Educational Research, 83 (3), 386-431.
Kuhfeld, M. & Soland, J. (in press). Using assessment metadata to quantify the impact of test disengagement on estimates of educational effectiveness. Journal of Research on Educational Effectiveness.
Patall, E.A., Cooper, H., & Allen, A.B. (2010). Extending the school day or school year: A systematic review of research (1985-2009). Review of Educational Research, 80, 401-436.
Redford, J., Burns, S., Ralph, J., & Hall, J. (2018). The summer after kindergarten: Children’s experiences by socioeconomic characteristics (NCES 2018–160). Washington, DC: U.S. Department of Education, National Center for Education Statistics.
Quinn, D. & Polikoff, M. (2017). Summer learning loss: What is it, and what can we do about it? Washington, DC: Brookings Institution..
von Hippel, P.T., & Hamrock, C. (2019). Do test score gaps grow before, during, or between the school years? Measurement artifacts and what we can know in spite of them. Sociological Science, 6, 43-80.
von Hippel, P.T., Workman, J., & Downey, D.B. (2018). Inequality in reading and math skills forms mainly before kindergarten: A replication, and partial correction, of “Are Schools the Great Equalizer?” Sociology of Education, 91, 323-357.
von Hippel, P.T. (2016). Year-round school calendars: Effects on summer learning, achievement, families, and teachers. In K. Alexander, S. Pitcock, & M. Boulay, M. (Eds.), The summer slide: What we know and can do about summer learning loss. New York, NY: Teachers College Press.
Citation: Kuhfeld, M. (2019, June 6). Rethinking summer slide: The more you gain, the more you lose. KappanOnline.
ABOUT THE AUTHOR

Megan Kuhfeld
MEGAN KUHFELD is a research scientist at the Collaborative for Student Growth at NWEA, Portland, OR.


